ALLEN CELL EXPLORER
  • About
      Institute
      1. News feed
      2. What we do
      3. Publications
      4. Allen Institute | allenInstitute.org
      5. Careers
      Site
      1. Home page
      2. Site updates
      3. Archived content
  • Allen Cell Collection
      Order cells & plasmids
      1. Cell Catalog
      2. Cell Catalog quickview
      3. Cell Shorts (documentaries on labs using our cells)
      4. Support forum
      Lab methods
      1. Instructional videos for success in the lab
      2. Standard operating procedures (written methods)
      3. Illustrated overviews
      About our hiPS cells
      1. hiPS Cell Structure Overview
      2. Visual Guide to Human Cells
      3. Cell structure observations
      4. Why endogenous tagging?
      5. Differentiation into cardiomyocytes
      6. Genomics
      7. Download cell data (images, genomics, features)
  • Data & Digital Tools
      Online image analysis
      1. Cell Feature Explorer (plotting & 3D viewer)
      2. 3D cell viewer (pre2018)
      3. Deep cell zoom (216,016 cells)
      Online modeling viewers
      1. Visual Guide to Human Cells
      2. Simularium (4D visual analysis)
      3. Integrated Mitotic Stem Cell
      4. └ Z-stack viewer
      5. └ 3D viewer
      6. Allen Integrated Cell viewer
      7. Label-free examples viewer
      8. 3D probabilistic model viewer
      Desktop tools
      1. Allen Cell & Structure Segmenter
      2. AGAVE 3D pathtrace image viewer
      Data & code
      1. Download cell data (images, genomics, features)
      2. Code repositories & software
  • Analysis & Modeling
      Allen Integrated Cell models
      1. Overview
      2. Integrated Mitotic Stem Cell
      3. └ Z-stack viewer
      4. └ 3D viewer
      5. Label-free Determination
      6. └ 3D viewer
      7. 3D Probabilistic Modeling
      8. └ 3D viewer
      9. Visual Guide to Human Cells
      4D biology models
      1. Simularium (online 4D viewer)
      Methodologies
      1. Drug perturbation pilot study
      2. hiPS cells during mitosis
      3. Differentiation into cardiomyocytes
  • Publications
      Articles
      1. All journal publications
      2. Preprints (biorxiv, arxiv)
      Posters
      1. Select posters
  • Education
      Education resources
      1. All Resources
      2. Teaching materials
      Online tools popular with teachers
      1. Visual Guide to Human Cells
      2. Integrated Mitotic Stem Cell
      3. Cell Feature Explorer (interactive plotting & 3D viewer)
      4. 3D cell viewer (pre2018 data)
      5. hiPS cell structure overview
  • Support
      Questions
      1. FAQs
      2. Forum
      Tutorials for digital tools
      1. Digital tool tutorials with videos
      2. Visual Guide tutorial
      3. AGAVE user guide
      Lab methods
      1. Instructional videos for success in the lab
      2. Standard operating procedures (written methods)
      3. Illustrated overviews
  • 🔍
      SEARCHBAR

Cell Structure Observations

Observations about microscopy videos for each of the 16 cell lines available in our Cell Catalog & 3D Cell Viewer.

Nucleolus visualized via nucleophosmin

4/24/2018

 
Movie. Z-stack and timelapse movie of nucleoli. The left panel shows a Z-stack of a live hiPS cell colony expressing mEGFP-tagged nucleophosmin. Cells were imaged in 3D on a spinning-disk confocal microscope. Right panel is the same image as the left but with contrast enhanced to visualize dimmer localization in mitotic cells. Movie starts at the bottom of the cells and ends at the top. Scale bar = 5µm.

Movie. Z-stack and timelapse movie of nucleoli. Timelapse movie of a live hiPS cell colony expressing mEGFP-tagged nucleophosmin. Cells were imaged on a spinning-disk confocal microscope every 3 min. Image is a maximum intensity projection through the volume of the cells. Frames were histogram matched to adjust for photobleaching. Movie plays at 900x real time. Scale bar = 5 µm.

Observations
  • Nucleophosmin marks the granular component of the nucleolus, the nuclear subcompartment where ribosomes are made.
  • During much of interphase the nucleolus exists in one to several large, textured clusters within the nucleus of hiPS cells. During cell division, the nucleolus appears to ‘melt’ and then dissociate. After cell division, the nucleolus reassembles, first into small particles and progressing into the larger textured clusters observed during interphase.
  • The mEGFP-tagged nucleophosmin exhibits many similarities with the mEGF-tagged fibrillarin, another marker of the nucleolus. However, it also exhibits notable differences, including its specific localization within the nucleolus, as each line marks a different component of the nucleus. The granular component of the nucleolus where nucleophosmin resides forms hollow-looking spheres, giving the nucleolus a mesh-like appearance when imaged with this marker.​

Plasma Membrane visualized via CAAX domain of K-Ras

4/24/2018

 
Figure 1. Timelapse movie of plasma membrane. Timelapse movie of a live hiPS cell colony expressing the CAAX domain of K-Ras tagged with mTagRFP-T. Cells were imaged in 3D on a spinning-disk confocal microscope every 5 min. Panels show the same colony at different z-positions. Left) The bottom z-section of the cells. Middle) A maximum intensity projection through the middle 5 z-sections of the cells. Right) A maximum intensity projection through the top 12 z-sections of the cells. Frames in each panel were histogram matched to adjust for photobleaching. Movie plays at 1500x real time. Scale bar = 5 µm.

Figure 2. Timelapse movie of plasma membrane. Timelapse movie of a live hiPS cells in an epithelial sheet containing both unedited cells (which remain unseen in black), and cells expressing the CAAX domain of K-Ras tagged with mTagRFP-T. Cells were imaged in 3D on a spinning-disk confocal microscope every 3 min; the top and bottom z-sections are shown pseudocolored in green and magenta, respectively. Movie plays at 1800x real time. Scale bar = 10 µm.
 
Observations
  • The plasma membrane of the cell forms a barrier between the cytoplasm and the extracellular space and neighboring cells. We labeled CAAX, the membrane-targeting domain of K-Ras with mTagRFP-T to label the plasma membrane.
  • In hiPS cells the plasma membrane exhibits differing behavior depending on the location in the cell. At the bottom of the cell, the membrane surrounds dynamic lamellar protrusions, which overlap with neighboring cells. At the middle region of cells, the plasma membrane clearly outlines the boundaries between cells. At the very top of cells, the membrane surrounds dynamic microvilli, seen as small textured puncta.
  • In addition, bright puncta are present throughout the cell, with a greater number near the top of the cell. These are likely endosomes created by plasma membrane taken into the cell.
  • By mixing the cells expressing this FP-tagged CAAX domain with unedited cells, the behavior of individual cells within a colony can be observed more clearly. Pseudocoloring a frame from the bottom of a z-stack in a different color from a frame from the top of the same stack permits visualization of the different behavior of the cell at each location. The bottom of the cell changes shape and explores more space than the top of the cell. The tops of cells appear anchored in space, consistent with the localization of cell junctional proteins to apical cell-cell boundaries. ​

Endosomes visualized via Ras-Related Protein Rab-5A

4/24/2018

 
A. Z-stack
B. Timelapse
Figures. Z-stack and timelapse movies of endosomes. A) Z-stack of a live hiPS cell colony expressing two copies (biallelic) of mEGFP-tagged Ras-related protein Rab-5A imaged in 3D on a spinning-disk confocal microscope. Movie starts at the bottom of the cells and ends at the top. Scale bar = 5µm. B) Timelapse movie of a live hiPS cell colony expressing two copies (biallelic) of mEGFP-tagged Ras-related protein Rab-5A. Cells were imaged on a spinning-disk confocal microscope. A single, mid-level plane was acquired every second. A zoom-in of the area boxed in the left panel is shown on the right. Movie sped up 10x real time. Scale bar = 5 µm.
 
Observations
  • Ras-related protein Rab-5A is a member of the Rabs, small Ras family GTPases that regulate intracellular membrane trafficking. Rab-5A localizes to endosomes; it plays a role in the fusion of endocytic vesicles with the early endosome, endosome maturation and vesicular transport. We thus visualized a subset of endosomes in cells via Rab5A.
  • In hiPS cells Rab5A-labeled endosomes are seen as small round puncta throughout the cytoplasm but they also sometimes exhibit a tubular morphology. Their size ranges from ~250nm to 2 µm in diameter with smaller endosomes predominantly at the bottom of cells and larger endosomes at the top.
  • Two different types of movement are seen, small random movement within a confined area, and directed longer-range movement, likely along microtubules. Tubular structures emanating from round endosomes were occasionally observed during their transport.
  • ​Endosome dynamics also included fission and fusion events.

Peroxisomes visualized via peroxisomal membrane protein PMP34

4/24/2018

 
A. Z-stack
B. Timelapse
Figures. Z-stack and timelapse movies of peroxisomes. A) Z-stack of a live hiPS cell colony expressing mEGFP-tagged peroxisomal membrane protein PMP34 imaged in 3D on a spinning-disk confocal microscope. Movie starts at the bottom of the cells and ends at the top. Scale bar = 5 µm. B) Timelapse movie of a live hiPS cell colony expressing mEGFP-tagged peroxisomal membrane protein PMP34. Cells were imaged on a spinning-disk confocal microscope every 1s. Movie sped up 10x real time. Images are shown with the despeckle ImageJ filter applied. Scale bar = 5 µm.
 
Observations
  • Peroxisomal membrane protein PMP34 localizes to peroxisomes, which are membrane-bound organelles that play a role in metabolism and in detoxifying hydrogen peroxide and other harmful substances in the cell.
  • In hiPS cells, peroxisomes are located throughout the cytoplasm in small puncta less than 100 nm in diameter. Two different types of movement are seen, small random movement within a confined area, and longer-range directed movement, likely along microtubules.  
  • ​Peroxisomes do not noticeably change their morphology and distribution during cell division.

Cell–cell contacts: Gap junctions visualized via connexin-43​

4/24/2018

 
A. Z-stack
B. Timelapse
Figures. Z-stack and timelapse movies of gap junctions. A) Z-stack of a live hiPS cell colony expressing mEGFP-tagged connexin-43. Cells were imaged in 3D on a spinning-disk confocal microscope. Movie starts at the bottom of the cells and ends at the top. Scale bar = 5 µm. B) Timelapse movie of a live hiPS cell colony expressing mEGFP-tagged connexin-43. Cells were imaged on a spinning-disk confocal microscope every 3.25 min. Image is a maximum intensity projection of 20 z-slices acquired at the top of the cells. Contrast is enhanced to show localization of connexin-43 to internal structures. Frames were histogram matched to adjust for photobleaching. Movie plays at 975x real time. Scale bar = 5 µm.
​
Observations
  • Connexin-43 is a key component of gap junctions, which are channels between cells that allow for small molecules and ions to pass directly between the cytoplasm of adjacent cells. Gap junctions often cluster in larger gap junction plaques.
  • In hiPS cells, connexin-43 localizes most prominently to many puncta (presumably clusters of individual channels) at apical cell-cell junctions near the very top of the cells. Some puncta are also seen near the bottom and middle of the cell although in smaller numbers.
  • Connexin-43 is also localized to the plasma membrane and in internal structures that resemble the Golgi. This localization likely reflects the assembly and trafficking of connexin into gap junctions.
  • ​As hiPS cells progress though mitosis, the apical puncta at cell-cell junctions remain intact, but the connexin-43 associated with internal organelles, e.g. the Golgi, becomes diffuse throughout the cell. ​

Golgi visualized via sialyltransferase 1 (also known as ß-galactoside α-2,6-sialyltransferase1)

10/5/2017

 
A. Z-stack 1-copy edit
B. Z-stack 2-copy edit
C. Z-stack 2-copy edit
Figure 1. Z-stack movies of Golgi. A) Z-stack of live hiPS cells expressing one copy (monoallelic) of mEGFP-tagged sialyltransferase 1 (ST6GAL1) imaged on a spinning-disk confocal microscope. Movie starts at the bottom of the cells and ends at the top. B) Z-stack of live hiPS cells expressing two copies (biallelic) of mEGFP-tagged sialyltransferase 1 (ST6GAL1) imaged on a spinning-disk confocal microscope. Movie starts at the bottom of the cells and ends at the top. Contrast settings for these two movies are identical to highlight the increased signal in the biallelic edited line (right). C) Z-stack of live hiPS cells expressing two copies (biallelic) of mEGFP-tagged sialyltransferase 1 (ST6GAL1; white) stained for DNA (NucBlue Live; cyan) and plasma membrane (CellMask Deep Red; magenta). Movie starts at the bottom of the cells and ends at the top.
A. Timelapse 6 hours
B. Timelapse 100 minutes
Figure 2. Timelapse movies of Golgi. A) Timelapse movie of hiPS cells expressing two copies (biallelic) of mEGFP-tagged sialyltransferase 1 (ST6GAL1). Images were taken in 3D every 3 min for 6 hrs on a spinning-disk confocal microscope. Images are maximum intensity projections with the ‘despeckle’ ImageJ filter applied. Playback speed is 1800x real time. B) Timelapse movie of hiPS cells expressing two copies (biallelic) of mEGFP-tagged sialyltransferase 1 (ST6GAL1). Images were taken in 3D every 5 min for 100 min on a spinning-disk confocal microscope. Images are maximum intensity projections with the ‘despeckle’ ImageJ filter applied. Playback speed is 900x real time.
Observations
  • Sialyltransferase 1 is a transmembrane protein that resides within the Golgi apparatus. It catalyzes the transfer of sialic acid from an activated donor molecule to galactose.
  • In hiPS cells, the Golgi comprises a set of lamellar structures localized near the top of the cell, often partially covering the nucleus (see 3D reconstruction). The structure of the Golgi becomes more tubular as it descends downward into the cell.
  • During cell division, the Golgi fragments into numerous small foci that are dispersed throughout the cell, and excluded from the mitotic spindle. These Golgi fragments reassemble in daughter cells after division.
  • Golgi morphology is difficult to visualize in immunostained cells as its lamellar structure easily collapses into a tubular morphology in response to fixation.

Lysosomes visualized via LAMP1

10/4/2017

 
A. Z-stack
B. Timelapse (apical)
C. Timelapse (basal)
Figures. Z-stack and timelapse movies of lysosomes. A) Z-stack of live hiPS cells expressing mEGFP tagged LAMP1 imaged on a spinning-disk confocal microscope. Movie starts at the bottom of the cells and ends at the top. Scale bar = 5µm. B–C) Timelapse movie of live hiPS cells expressing mEGFP-tagged LAMP1. Images were taken as a single slice near the top (B) or bottom (C) of the cell every 1 sec for 100 sec on a spinning-disk confocal microscope. Images have had the ‘despeckle’ ImageJ filter applied. Movie sped up 10x real time. Scale bar = 5 µm.
​
Observations
  • Lysosomes are membrane-bound organelles responsible for breaking down unwanted cellular materials for reuse. They are often considered the “waste disposal” sites within cells. LAMP1 is a transmembrane glycoprotein, which together with LAMP2 is the most abundant protein present in the lysosomal membrane (~50% of membrane proteins), making it a great reporter protein for lysosomes.
  • Lysosomes are classically known to form round vesicles of different sizes. However, they can also take on tubular morphologies, something that is less commonly known because these tubules are often lost upon fixation. In hiPS cells, lysosomal tubules are more visible in the bottom half of cells. Smaller vesicles are also predominant near the bottom while larger vesicles are mainly found at the top of the cells.
  • Lysosomes are very dynamic. Round vesicular lysosomes move around the cell rapidly, sometimes with a stop and go motion. They also deform, most dramatically when one end is pinched into a tear-drop shape. This can also be associated with the pulling out of tubular lysosomes.
  • Tubular lysosomes are also very dynamic, with branches being pulled out and fission and fusion dynamics altering their morphology.
  • In recent literature, tubular lysosomes have been implicated as being structures connecting the lysosome to other intracellular compartments (e.g. late endosome) and being involved in the fusion process between these compartments. Tubular lysosomes have also been shown to be a precursor to lysosome formation via budding during cell starvation.

Centrioles via Centrin 

10/3/2017

 
Picture
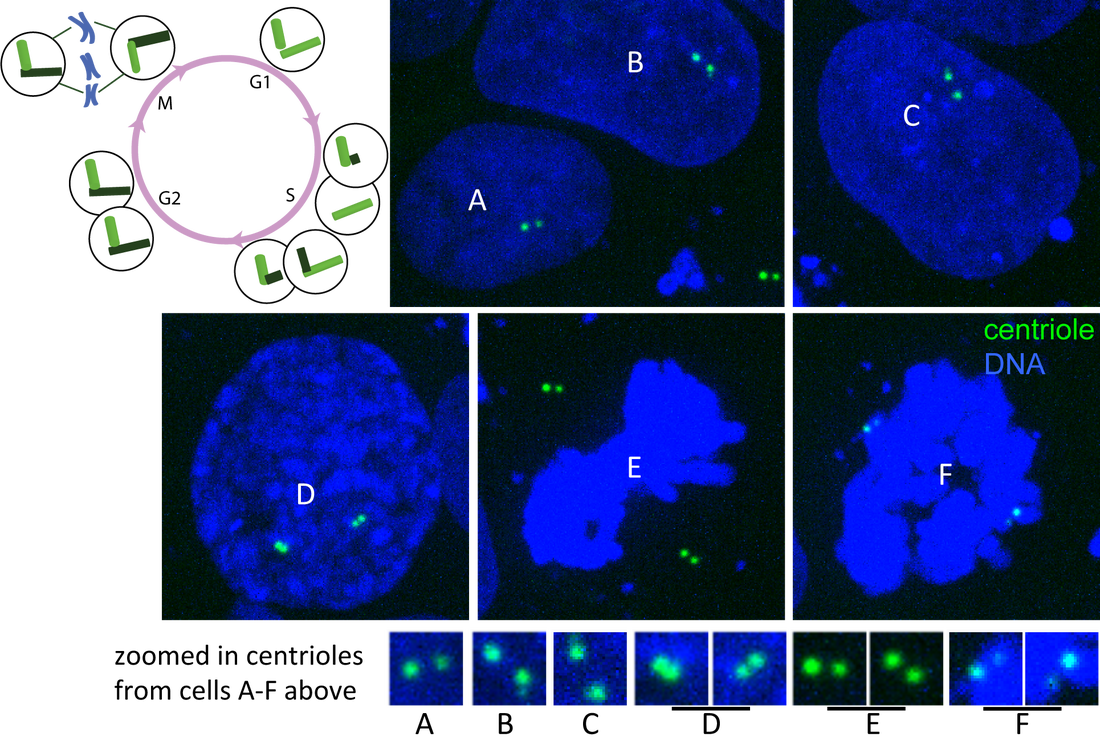
Figure. Centrin and DNA through cell cycle. Single plane images of hiPS cells expressing mTagRFP-T–tagged centrin (green) and labeled with Hoechst dye (DNA; blue) imaged on a spinning-disk confocal microscope. Cells labeled A-F represent different stages of the cell cycle (see diagram). A) G1-phase, B) early S-phase, C) later S-phase, D) G2/M-phase and E–F) M-phase contain centrioles at distinguishable stages of duplication (see zoomed in images and cell cycle diagram).

Observations
  • Centrin is a key protein in centrioles, which are small cylindrical structures made primarily of tubulin. Centrioles are important components of centrosomes, the structures that form microtubule organizing centers. Centrioles are also found at the base of cilia and flagella.
  • Centrioles localize to the very top of the hiPS cells in interphase, consistent with the presence of primary cilia, which emanate from the centrioles. Centriole duplication and separation is observed throughout the cell cycle consistent with models of cell cycle regulation of centriole behavior. Small daughter centrioles are seen to appear next to their mother centrioles and grow in size.
  • See FAQs for reasoning behind on our choice of red-fluorescent protein tagging.

Cell–cell contacts: ​Tight junctions visualized via ZO-1

4/1/2017

 
High magnification timelapse
Low magnification timelapse
Figure. Timelapse movies of ZO-1 in tight junctions. Timelapse movies of live hiPS cells expressing mEGFP-tagged tight junction protein ZO-1 imaged on a spinning-disk confocal microscope. Images were collected in 3D every 3 min for 1.5 hrs (left) or for 15 hrs (right). Images are maximum intensity projections; playback speed is 910x (left) and 1800x (right) real time.

Observations
  • ZO-1 is a tight junction-associated protein that connects adjacent epithelial cells near the apical surface. The tight junctions form a continuous ring around the cell, limiting passage of molecules between the top and bottom of the cells or the tissues they comprise.
  • In hiPS cells, ZO-1 forms a ring around each cell near the apical surface. Due to this localization, it is a good marker for the apical cell periphery as the cells grow, divide and move around within the colony.
  • The ZO-1 band becomes less coherent and widens during cell division, perhaps due to a release of tension between cells.
  • During division, ZO-1 forms rosette-like structures as neighboring cells maintain tight contact with each other when another cell is expelled from the epithelial ‘sheet’. This rosette is resolved as cells move within the colony, grow and divide.

​Cell–cell contacts: desmosomes visualized via desmoplakin

3/21/2017

 
Z-stack with overlay
Low magnification timelapse
Figure. Movies of desmoplakin in desmosomes. Top: Z-stack of live hiPS cells expressing mEGFP-tagged desmoplakin imaged on a spinning-disk confocal microscope. Images start from the bottom of the cells and end at the top. The right panel shows the left panel overlaid onto the equivalent transmitted light image. Bottom: timelapse movie of a hiPS cell colony expressing mEGFP-tagged desmoplakin. Images were collected in 3D every 4 minutes for 8 hours on a spinning-disk confocal microscope. Images are maximum intensity projections; playback speed is 2400x real time.

Observations
  • Desmoplakin is involved in the linkage of intermediate filaments to cell-cell adhesion sites (desmosomes) in epithelial cells. These desmosomes are seen as small puncta at apical cell-cell boundaries.
  • In hiPS cells, desmoplakin puncta are not visible in all cells. However, when present there are between 1 and ~20 puncta present per cell.
  • There may be position-dependent differences in number of desmosomes depending on the spatial location of a cell within a colony. For example, we observe differences between the number of desmosomes in the tightly-packed centers of colonies vs. the flatter, less epithelial-like cells at the edges of colonies; however, this is a casual rather than a rigorous observation.
  • Desmosomes stay intact during cell division
<<Previous
Forward>>

    About

    Observations and descriptions from the microscope

    Archives

    February 2019
    August 2018
    April 2018
    October 2017
    April 2017
    March 2017

    Categories

    All
    3-channel
    3D Rotation
    Actin
    Actinomyosin
    Actin Structures
    Adhesions
    Cardiomyocyte
    Cell Cell Contacts
    Cell-cell Contacts
    Cell Contacts
    Cell Division
    Cell Membrane
    Centrin
    Centrioles
    Chromatin
    Colony
    Connexin
    Connexin-43
    Desmoplakin
    Desmosomes
    DNA
    Endoplasmic Reticulum
    Endosome
    ER
    Fibrillarin
    FUS
    Gap Junctions
    Golgi Apparatus
    H2B
    Histone
    K-Ras
    Lamin
    Lamin B1
    LAMP1
    Lysosomes
    MEGFP
    Membrane
    Microtubule
    Mitochondria
    Mitosis
    MLC-2a
    MLC 2v
    MTagRFP-T
    Muscle
    Myosin
    Nuclear
    Nuclear Envelope
    Nuclear Pores
    Nucleolus
    Nucleophosmin
    Nucleoporin
    Nucleus
    Nup153
    Paraspeckles
    Paxillin
    Peroxisome
    Plasma Membrane
    PMP34
    Rab-5A
    Ras
    RNA-binding Protein
    Sarcomere
    Sarcomere M-line
    Sarcomere Thick Filaments
    Sarcoplasmic Reticulum
    Sec61
    SERCA2
    Sialyltransferase 1
    SMC 1A
    ß-actin
    ST6GAL1
    Stress Granules
    Tight Junctions
    Time Lapse
    Time Series
    Titin
    Tom20
    Troponin
    Tubulin
    ZO1
    Z Stack

    RSS Feed

Home

Terms of Use

Citation Policy

Privacy Policy

FAQs

Help

Send us a message

Our diversity, equity & inclusion commitment
Copyright © 2023 Allen Institute. All Rights Reserved.
cellscience.alleninstitute.org
  • About
      Institute
      1. News feed
      2. What we do
      3. Publications
      4. Allen Institute | allenInstitute.org
      5. Careers
      Site
      1. Home page
      2. Site updates
      3. Archived content
  • Allen Cell Collection
      Order cells & plasmids
      1. Cell Catalog
      2. Cell Catalog quickview
      3. Cell Shorts (documentaries on labs using our cells)
      4. Support forum
      Lab methods
      1. Instructional videos for success in the lab
      2. Standard operating procedures (written methods)
      3. Illustrated overviews
      About our hiPS cells
      1. hiPS Cell Structure Overview
      2. Visual Guide to Human Cells
      3. Cell structure observations
      4. Why endogenous tagging?
      5. Differentiation into cardiomyocytes
      6. Genomics
      7. Download cell data (images, genomics, features)
  • Data & Digital Tools
      Online image analysis
      1. Cell Feature Explorer (plotting & 3D viewer)
      2. 3D cell viewer (pre2018)
      3. Deep cell zoom (216,016 cells)
      Online modeling viewers
      1. Visual Guide to Human Cells
      2. Simularium (4D visual analysis)
      3. Integrated Mitotic Stem Cell
      4. └ Z-stack viewer
      5. └ 3D viewer
      6. Allen Integrated Cell viewer
      7. Label-free examples viewer
      8. 3D probabilistic model viewer
      Desktop tools
      1. Allen Cell & Structure Segmenter
      2. AGAVE 3D pathtrace image viewer
      Data & code
      1. Download cell data (images, genomics, features)
      2. Code repositories & software
  • Analysis & Modeling
      Allen Integrated Cell models
      1. Overview
      2. Integrated Mitotic Stem Cell
      3. └ Z-stack viewer
      4. └ 3D viewer
      5. Label-free Determination
      6. └ 3D viewer
      7. 3D Probabilistic Modeling
      8. └ 3D viewer
      9. Visual Guide to Human Cells
      4D biology models
      1. Simularium (online 4D viewer)
      Methodologies
      1. Drug perturbation pilot study
      2. hiPS cells during mitosis
      3. Differentiation into cardiomyocytes
  • Publications
      Articles
      1. All journal publications
      2. Preprints (biorxiv, arxiv)
      Posters
      1. Select posters
  • Education
      Education resources
      1. All Resources
      2. Teaching materials
      Online tools popular with teachers
      1. Visual Guide to Human Cells
      2. Integrated Mitotic Stem Cell
      3. Cell Feature Explorer (interactive plotting & 3D viewer)
      4. 3D cell viewer (pre2018 data)
      5. hiPS cell structure overview
  • Support
      Questions
      1. FAQs
      2. Forum
      Tutorials for digital tools
      1. Digital tool tutorials with videos
      2. Visual Guide tutorial
      3. AGAVE user guide
      Lab methods
      1. Instructional videos for success in the lab
      2. Standard operating procedures (written methods)
      3. Illustrated overviews
  • 🔍
      SEARCHBAR