Overview of drug perturbation pilot study
Our goal is to identify signature profiles of cellular organization for a range of well-characterized agonists and antagonists commonly used to perturb specific cellular processes or pathways. To do this, we developed a scalable and reproducible imaging pipeline using GFP-tagged human induced pluripotent stem cells (hiPSC) that illuminates the 3D organization of the major cellular structures. The cells are from the Allen Cell Collection, which is a set of well characterized cell lines, each expressing a GFP-tagged protein that shows the location of a particular cell organelle or structure.
The analysis not only shows the effects of these drugs on structures they are known to perturb but also on other structures providing a rich signature of pathway alterations. For examples, we observed unreported reorganization of the ER in presence of placlitaxel, relocalization of cell junction proteins and disruption of actomyosin bundle in presence of staurosporine, fragmentation of golgi and cell junctions in presence of blebbistatin and reorganization of golgi in presence of rapamycin. Here, we present the initial 3D imaging workflow we are using to identify these signatures.
The analysis not only shows the effects of these drugs on structures they are known to perturb but also on other structures providing a rich signature of pathway alterations. For examples, we observed unreported reorganization of the ER in presence of placlitaxel, relocalization of cell junction proteins and disruption of actomyosin bundle in presence of staurosporine, fragmentation of golgi and cell junctions in presence of blebbistatin and reorganization of golgi in presence of rapamycin. Here, we present the initial 3D imaging workflow we are using to identify these signatures.
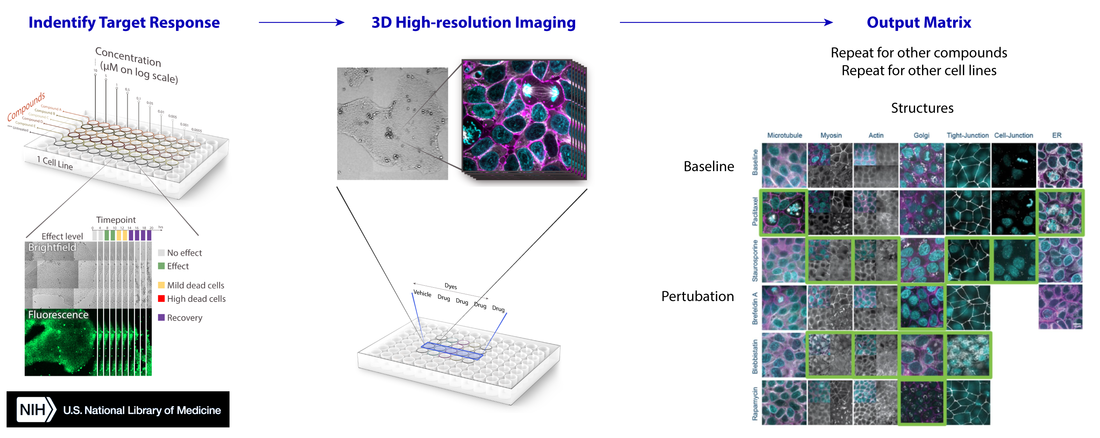
Workflow. The pipeline was prototyped using a small suite of well-characterized drugs including brefeldin A, paclitaxel, rapamycin, wortmannin, and staurosporine. These drugs were chosen based on their well-documented effects on the organization of a specific structure or the inhibition of a signaling pathway. Initial conditions were selected either by an image-based dose-response study at 20x magnification or based on reported effects in the literature. We then performed 3D high magnification (120x) imaging at the selected time point and drug concentration determined for each drug and cell line combination. All hiPSCs were labeled with NucBlue Live (DNA, Cyan) and CellMask Deep Red (Cell membrane, magenta) and imaged with a Zeiss spinning disk (Yokogawa CSU-X) confocal and Hamamatsu Orca-Flash4.0 V2 CMOS camera. Results were aggregated into a matrix.
Target conditions
Name |
Action |
Concentration selected [µM] |
Time point selected [hrs] |
(S)-nitro-Blebbistatin (SNB) |
Non-muscle Myosin II ATPase inhibitor |
50 |
1 |
Paclitaxel (Taxol) |
Microtubule polymer stabilizer |
5 |
2 |
Brefeldin A |
Vesicle trafficking inhibitor |
5 |
0.5 |
Rapamycin |
mTOR inhibitor (G1/S cell cycle arrest) |
0.1 |
24 |
Staurosporine |
Protein kinase inhibitor |
0.5 |
2 |
Table. List of well-characterized drugs used in this pilot study.
Drug-induced phenotypic signatures
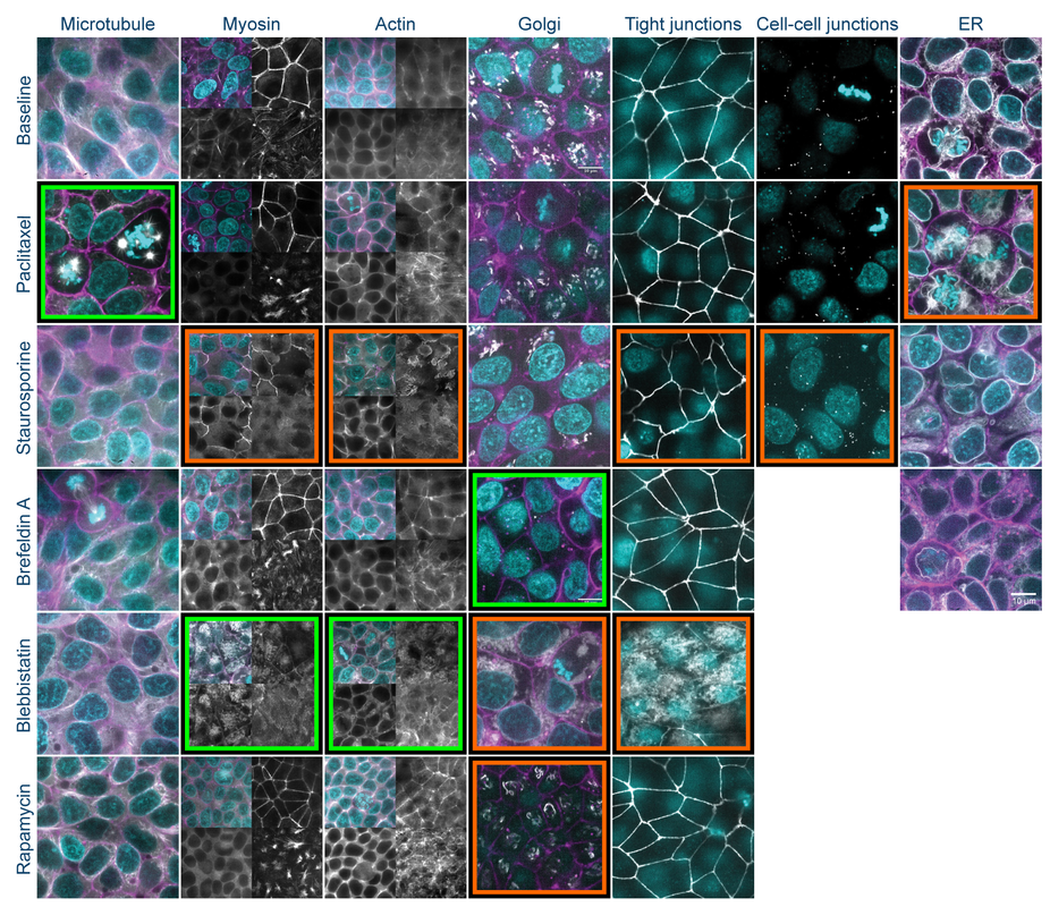
Drug Signature. The above shows a matrix of representative image planes from z-stacks collected at 120x of the GFP-tagged cell lines with nucleus and cell membrane markers. Cells were treated with the indicated perturbation agent at a pre-selected concentration and time point (see Table 1). Except as noted, all images are single planes from the center of the z-stack with the GFP-tagged structure in white, the nucleus in cyan, and the cell membrane in magenta. For myosin and actin, 3 additional planes are shown without nucleus and cell membrane markers (clockwise from top right, the images are single planes at the top, bottom, and middle of the z-stack). Visually observable target (green frame) and non-target (orange frame) morphological effects are highlighted. Scale bar is 10µm.
Observed effects
Paclitaxel
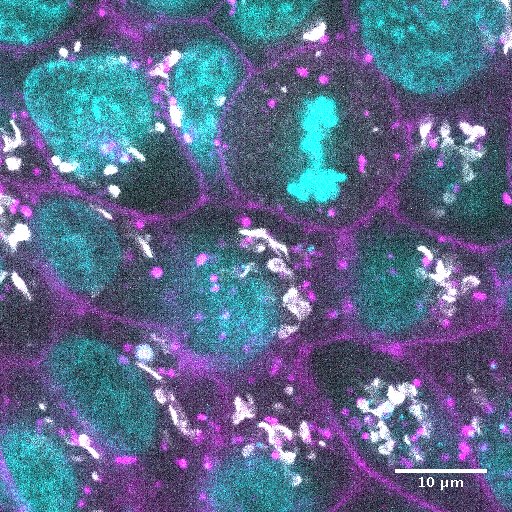
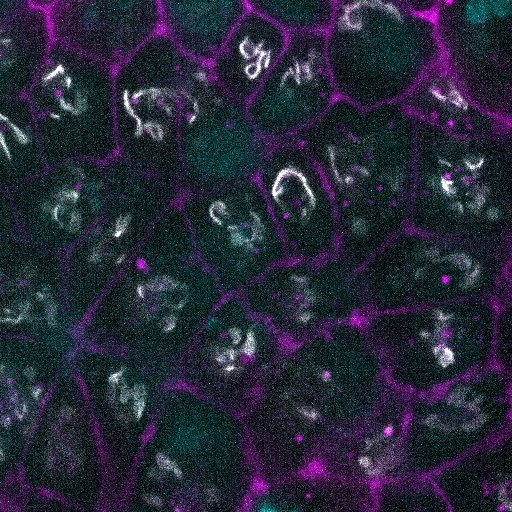
The microtubule-stabilizing agent paclitaxel increased microtubule bundle thickness and altered the shape and position of the mitotic spindle during hiPS cell division. In addition, paclitaxel also altered the organization of the endoplasmic reticulum (ER) during mitosis. While the perinuclear ER remains a mostly continuous envelope during cell division, in the presence of paclitaxel, the perinuclear ER diffuses and forms dense clusters by the multi-polar mitotic spindles formed due to paclitaxel treatment. Paclitaxel did not show major effects on organization of the actin filament bundles or cell-cell junctions.
The microtubule-stabilizing agent paclitaxel increased microtubule bundle thickness and altered the shape and position of the mitotic spindle during hiPS cell division. In addition, paclitaxel also altered the organization of the endoplasmic reticulum (ER) during mitosis. While the perinuclear ER remains a mostly continuous envelope during cell division, in the presence of paclitaxel, the perinuclear ER diffuses and forms dense clusters by the multi-polar mitotic spindles formed due to paclitaxel treatment. Paclitaxel did not show major effects on organization of the actin filament bundles or cell-cell junctions.
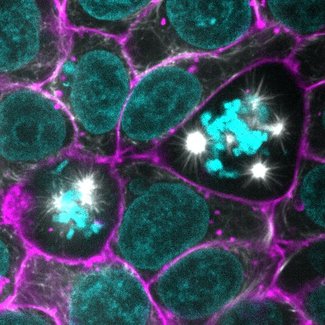
Single center plane showing the effect of paclitaxel on the target microtubule during mitosis.
|
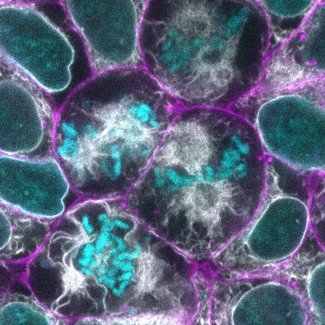
Single center plane showing the effect of paclitaxel on a non-targeted structure, the ER, during mitosis.
|
Staurosporine
Staurosporine, a broad kinase inhibitor, had major effects on colony and cell morphology, inducing rearrangements in cell packing and shape. Staurosporine also induced re-localization of desmosomes and ZO-1 from a tightly localized band near the apical surface to a broader distribution throughout the cell surface and disrupted actomyosin bundles near the basolateral surface.
Staurosporine, a broad kinase inhibitor, had major effects on colony and cell morphology, inducing rearrangements in cell packing and shape. Staurosporine also induced re-localization of desmosomes and ZO-1 from a tightly localized band near the apical surface to a broader distribution throughout the cell surface and disrupted actomyosin bundles near the basolateral surface.
|
Z-stack movies of live hiPS showing the effect of staurosporin on cell junction protein ZO-1 (expected target). Images are played from the bottom of the cells to the top.
|
Z-stack movies of live hiPS showing the effect of staurosporin on myosin contractile fibers (non-expected target). Images play from the bottom of the cells to the top.
|
Brefeldin A
Brefeldin A fragmented the Golgi apparatus into multiple foci dispersed throughout the cell volume within 30 min of treatment. This fragmentation is similar to that normally observed during mitosis. None of the other structures studied showed major changes.
Brefeldin A fragmented the Golgi apparatus into multiple foci dispersed throughout the cell volume within 30 min of treatment. This fragmentation is similar to that normally observed during mitosis. None of the other structures studied showed major changes.
Blebbistatin
(S)-nitro blebbistatin (SNB), a more photostable form of blebbistatin, inhibits the non-muscle myosin II ATPase. It induced reorganization and a relative decrease in number of actomyosin bundles. It also induced fragmentation and dispersal of the Golgi throughout the cell volume; however, in contrast to the effect of brefeldin A, the fragments were large and diffuse. (S)-nitro blebbistatin also produced a reorganization of the tight-junction protein ZO-1, with fragmentation of the cortical ring near the apical surface and redistribution throughout the entire volume of the cell. (S)-nitro blebbistatin had minimal effects on microtubule organization.
(S)-nitro blebbistatin (SNB), a more photostable form of blebbistatin, inhibits the non-muscle myosin II ATPase. It induced reorganization and a relative decrease in number of actomyosin bundles. It also induced fragmentation and dispersal of the Golgi throughout the cell volume; however, in contrast to the effect of brefeldin A, the fragments were large and diffuse. (S)-nitro blebbistatin also produced a reorganization of the tight-junction protein ZO-1, with fragmentation of the cortical ring near the apical surface and redistribution throughout the entire volume of the cell. (S)-nitro blebbistatin had minimal effects on microtubule organization.
|
Z-stack movies of live hiPS showing the effect of Blebbistatin on cell junction protein ZO-1 (non expected target). Images play from the bottom of the cells to the top.
|
Z-stack movies of live hiPS showing the effect of Blebbistatin on myosin contractile fibers (expected target). Images play from the bottom of the cells to the top.
|
Rapamycin
Rapamycin, an inhibitor of the mTOR pathway and activator of autophagy, produced only a subtle change in Golgi organization, which showed a thinner laminar structure. It did not produce major effects on the other structures examined following a 24 hr treatment.
Rapamycin, an inhibitor of the mTOR pathway and activator of autophagy, produced only a subtle change in Golgi organization, which showed a thinner laminar structure. It did not produce major effects on the other structures examined following a 24 hr treatment.
Single center plane showing the effect of Rapamycin on Golgi morphology.
•Vehicle control |
Single center plane showing the effect of Rapamycin on Golgi morphology.
•24hr treatment with Rapamycin |