Summary on the epithelial nature of hiPS cells grown on 2D substrate
|
We have a series of observations based on the localization pattern of 10 intracellular structures that are all consistent with an apical-basal polarity and epithelial sheet nature of hiPS cell colonies:
|
hiPS cells grow in single-cell layer colonies on 2D surfaces
|
Bright field movie of entire colony in time
|
Close up of colony (division occurring near top)
|
Figure 1. Transmitted light timelapse movies of live hiPSC cells imaged on a spinning-disk confocal microscope. Images were collected every 5 minutes for 3 hours. Playback speed is 3000x real time.
Observations
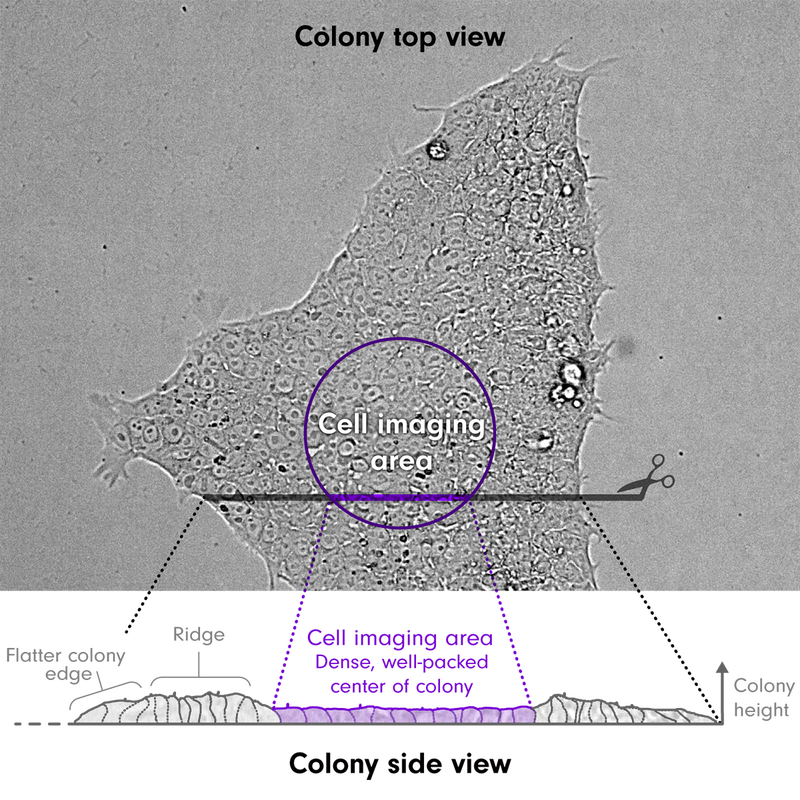
- Colonies are very dynamic, with cells growing, dividing, and dying (turn-over) within the colony as the colony itself grows and expands. The colony edges are constantly protruding, extending lamellipodia and retracting. Cells within healthy colonies are tightly packed next to each other in a single sheet.
- Cells are approximately 10-20 microns tall and 5-20 microns in diameter. Over time the cells at the center of colonies become extremely tightly packed and flatten. As the cell density in this region increases, more cells undergo apoptosis and are expelled upward out of the monolayer. Cells at the edges of colonies are much flatter, with large flat lamellipodial regions. Cells between the center and edge of a colony are the tallest, forming a ‘ridge’.
- As cells move, they push and pull on each other, exhibiting a coherence in their movement. Dividing cells usually divide near the top of the colony, and then intercalate back into the colony, but often not directly adjacent to each other.
- Groups of cells residing near each other often seem to divide at about the same time (see also e.g. timelapse movies of colonies of cells expressing tagged α-tubulin below). This could be because sister cells may be more in synchrony with each other and also closer to each other within the colony.
General organization of hiPS cells
|
Microtubules
|
Mitochondria
|
Golgi
|
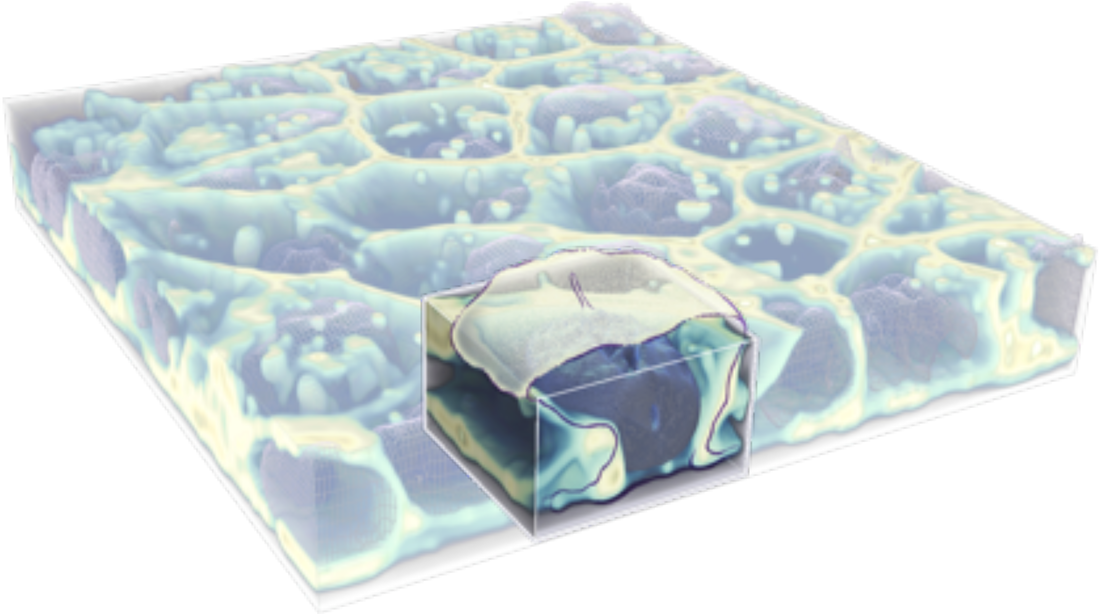
3D colony rendering with interpreted cell illustration
Figure 2. Z-stack movies of live hiPS cells. Three examples of cells expressing mEGFP tagged α-tubulin (A) in microtubules, Tom20 (B) in mitochondria, and ß-galactoside α-2,6-sialyltransferase 1 (C) in Golgi imaged on a spinning-disk confocal microscope. Images start from the bottom of the cells and end at the top. The left and center movie include fluorescent dyes that label the cell membrane (magenta) and the DNA/nucleus (cyan). (D) 3D illustration of the organization of hiPS cells in a monolayer colony.
Observations
- In general, cells are columnar with differences in the distribution of intracellular structures and organelles depending on their apical-basal location. However, the cells often lean over each other such that they are not necessarily cylindrical but instead can form a wide range of 3D shapes.
- The nucleus in these cells occupies ~30-50% of the cell volume and most of the cytoplasmic space especially in the center region of the cells.
- Key organelles and structures localize more densely in a cytoplasmic ‘pocket’ above the nucleus and are sparser towards the bottom of the cell. Example structures that exhibit this localization pattern include microtubules, which seem to emanate from the top to the bottom (see microtubule section), mitochondria, which are more densely clustered in the top, and the Golgi which is primarily localized to the top of cells.