Try the full AGAVE pathtrace viewer on your desktop
What's New in AGAVE v1.6.0 | April 17th, 2024
- new in-viewport interactive light rotation widget (Press R to toggle)
- Help menu and About dialog
- Scale bar
- Option to preserve all current settings when loading an image
- Update Qt to use Fusion style for more consistent look cross-platform
- Server mode now supports raymarch render mode
- Loads tiff files written by SCIFIO
- Several minor ui bug fixes
See our announcement on image.sc forum!
|
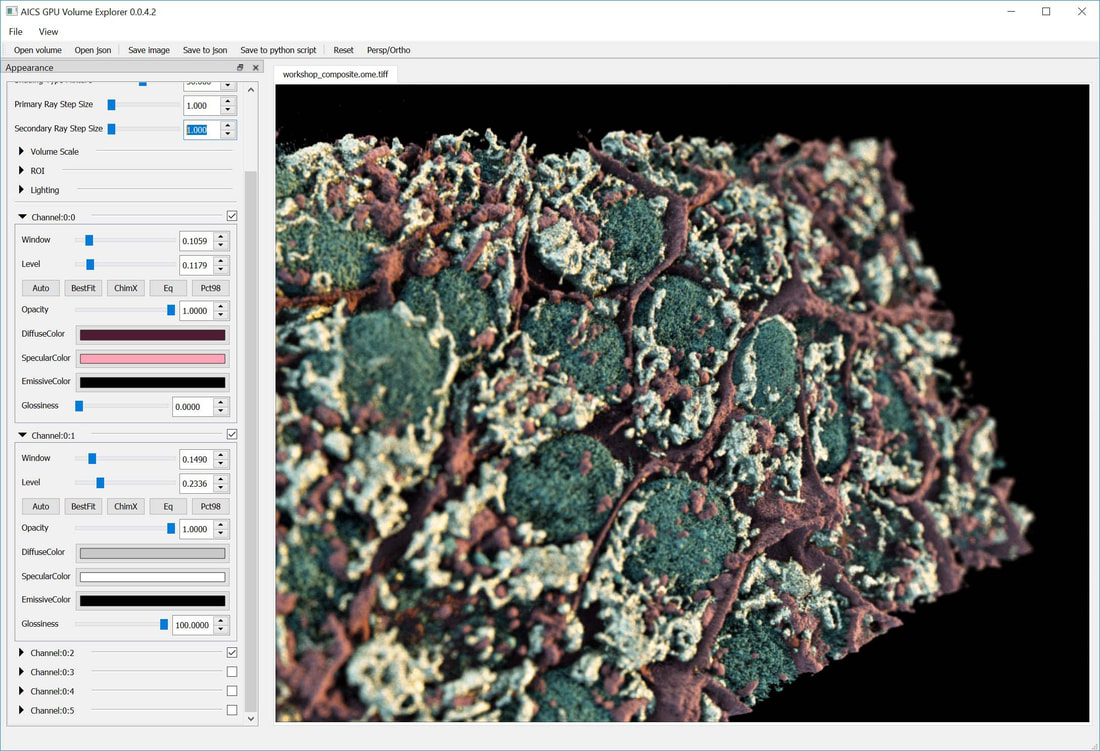
Description: The volume viewer uses path-trace rendering in an interface designed and optimized for the display of multi-channel OME TIFF or OME-Zarr files.
Requirements: This stable release requires a computer running the latest version of Windows 10 or Mac OS 10.12 or newer, or can be built from GitHub source for Linux.
Instructions: Unzip the contents into a new directory on your computer, and launch AGAVE. You may have to follow standard procedures to bypass security warnings. Open the accompanied documentations for detailed instructions on how to load and visualize volumetric data files.
Windows only: The first time you run AGAVE, if you see an error message about missing VCRUNTIME140_1.dll, then you need to download and install vc_redist.x64.exe from this link. After the install, AGAVE should start normally. |
Available for Windows & MacOS
|
Try a simple pathtrace viewer directly in your browser
|
|
Visualization Advances for Enhancing Spatial Relationships… Even Online
Most volumetric visualization tools that cell biologists use have evolved from 2D image analysis predecessors. They provide powerful analysis capabilities, especially for looking at one slice of a 3D volume or a projection, but they have limited 3D visualization functionality. Transforming a stack of 2D slices into a 3D volume and then interactively rotating it makes complex spatial relationships easier to see and understand.
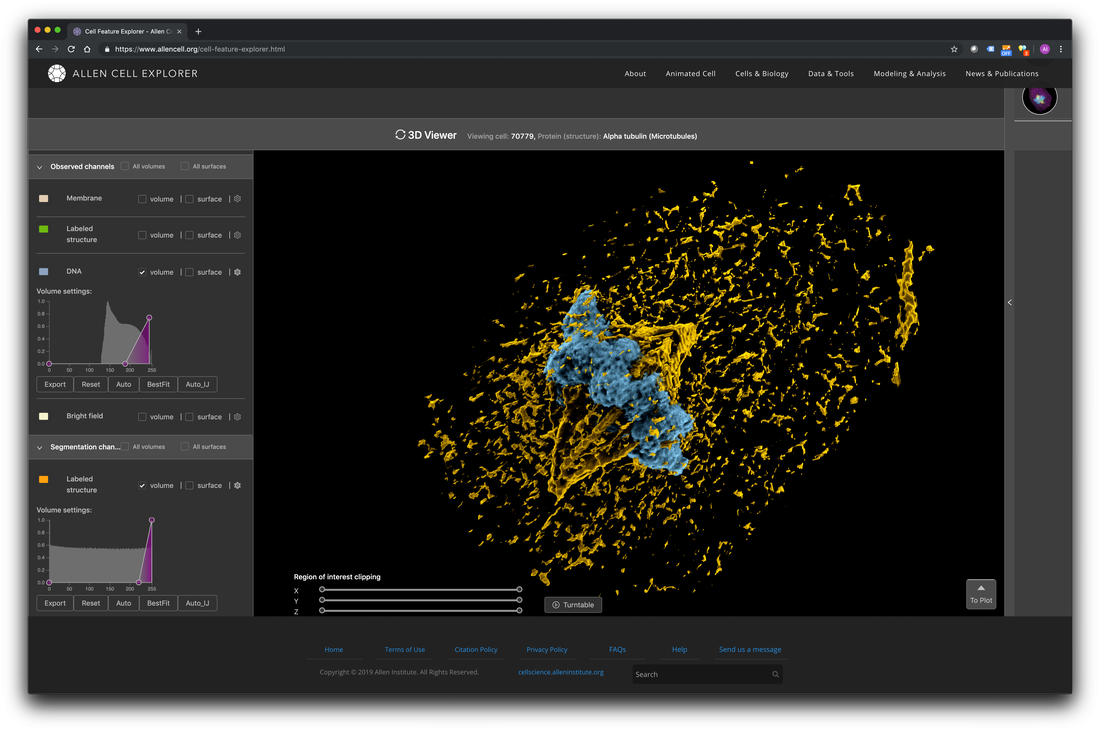
The most common 3D volume rendering methods make the stacked image slices transparent so the observer can see through the entire volume. However, this can compromise the appearance and detail of the signal (Fig. 1A). Users can adjust the transparency to make denser voxels (the 3D analog to pixels) stand out, but this rendering approach is far removed from how we view and intuitively interact with everyday objects, lacking, for example, any concept of a directional light source, adjustable highlights, or shadows that can help us intuit complex topologies and distance relationships. The volumes can require longer interactions and more experience to interpret, and it can be impossible to correctly interpret depth relationships if the user cannot interactively rotate the volume, for example if it is displayed on a printed page.
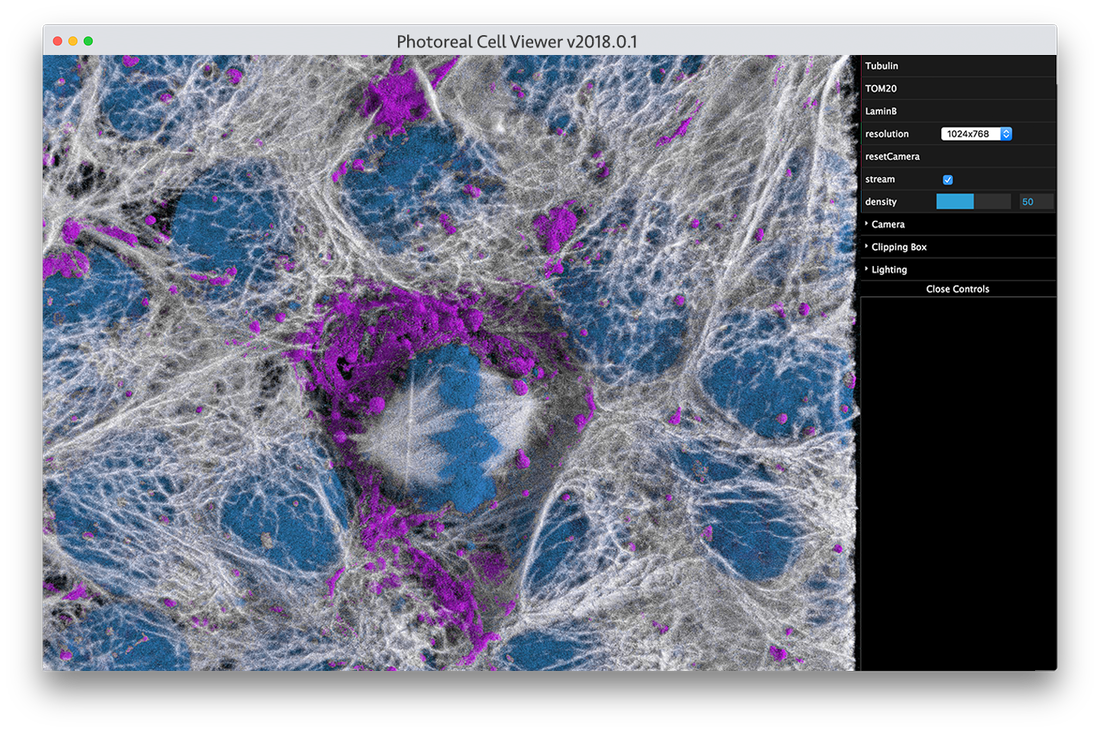
New approaches to rendering volumes are being adapted and developed for use in cell biology to help us literally see the cells in a more familiar and thus intuitive manner. For example, by adopting approaches such as “cinematic rendering” techniques to cellular volumetric data, one can see fine details become more visible and spatial relationships more interpretable, even in a 2D static printed image (Fig. 1B). This makes exploring cellular data more analogous to dissecting a cadaver rather than looking only at x-ray projections when learning human anatomy. These types of approaches should become an important addition to the arsenal of visual analysis tools needed to study and see a cell from every possible perspective and in every possible way. This cinematic approach can also be adjusted to emulate the method shown in (a) when transparency is useful.
The most common 3D volume rendering methods make the stacked image slices transparent so the observer can see through the entire volume. However, this can compromise the appearance and detail of the signal (Fig. 1A). Users can adjust the transparency to make denser voxels (the 3D analog to pixels) stand out, but this rendering approach is far removed from how we view and intuitively interact with everyday objects, lacking, for example, any concept of a directional light source, adjustable highlights, or shadows that can help us intuit complex topologies and distance relationships. The volumes can require longer interactions and more experience to interpret, and it can be impossible to correctly interpret depth relationships if the user cannot interactively rotate the volume, for example if it is displayed on a printed page.
New approaches to rendering volumes are being adapted and developed for use in cell biology to help us literally see the cells in a more familiar and thus intuitive manner. For example, by adopting approaches such as “cinematic rendering” techniques to cellular volumetric data, one can see fine details become more visible and spatial relationships more interpretable, even in a 2D static printed image (Fig. 1B). This makes exploring cellular data more analogous to dissecting a cadaver rather than looking only at x-ray projections when learning human anatomy. These types of approaches should become an important addition to the arsenal of visual analysis tools needed to study and see a cell from every possible perspective and in every possible way. This cinematic approach can also be adjusted to emulate the method shown in (a) when transparency is useful.
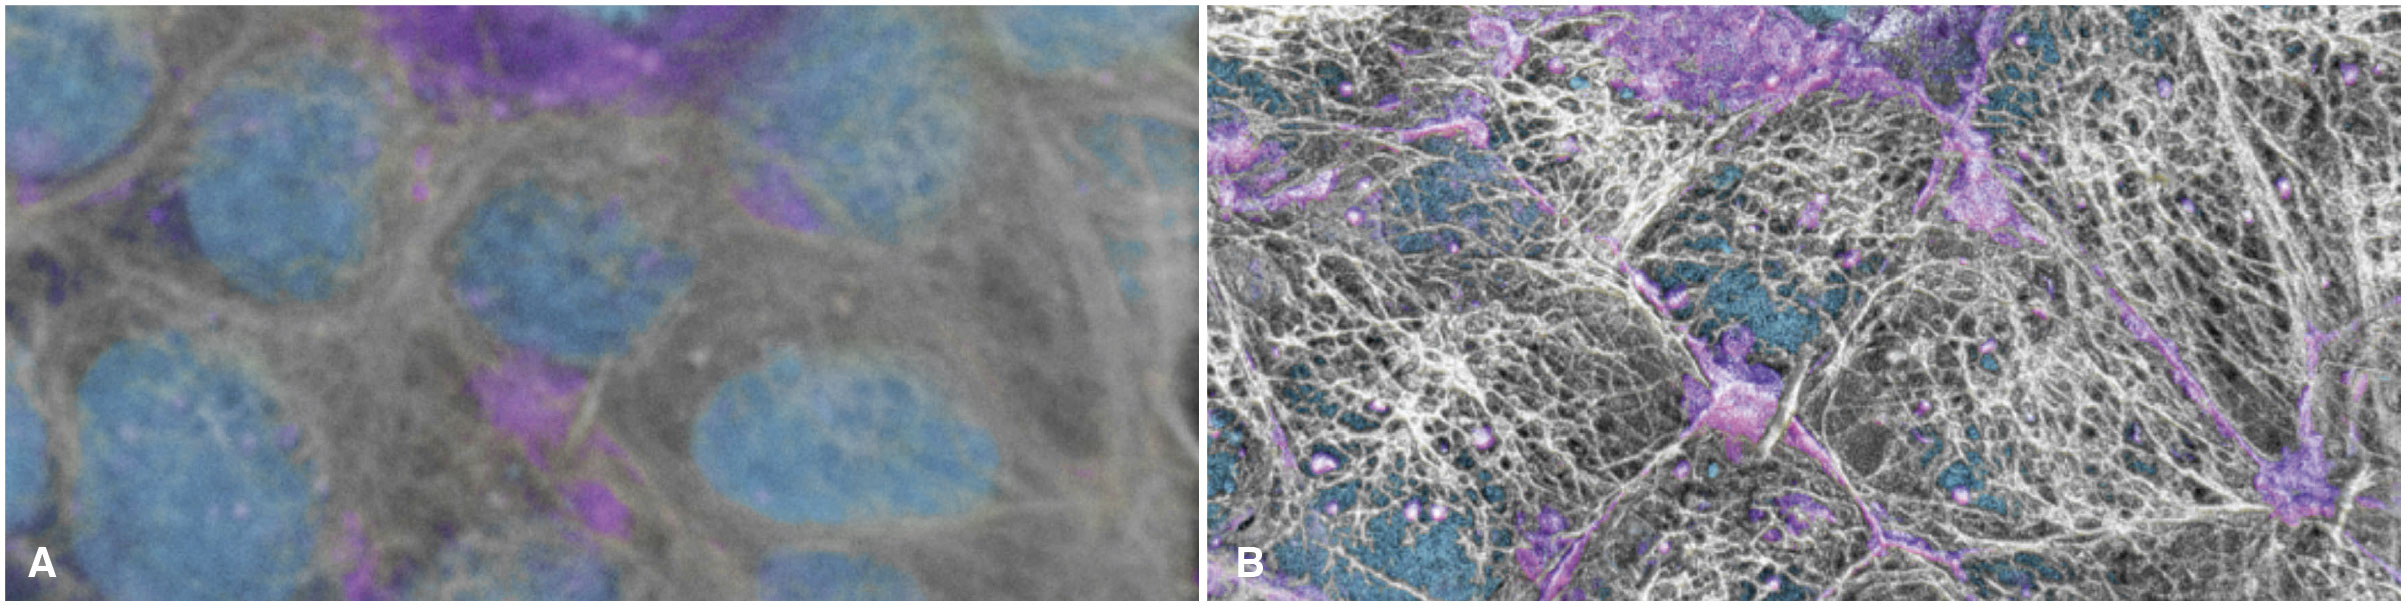
Figure 1: Live hiPS cells in a monolayer are labeled for the cell boundary (magenta), DNA (cyan), and microtubules (white). Cells are imaged in 3D using spinning disk confocal microscopy and the image is displayed with: a) the most common type of volume rendering method as in this example from www.allencell.org/3d-cell-viewer.html; and b) newly adopted “cinematic lighting” techniques to volume rendering in development at the Allen Institute for Cell Science.