|
|
The human induced pluripotent stem cells we raise in culture at the Allen Institute for Cell Science grow and divide as you can see in this time series movie of 38 frames collected every 3.5 minutes over approximately two hours. The time series is rendered as maximum intensity projection of 7 slices in center of the cell.
The cells were imaged on the Zeiss 880 AiryScan |
Creating the Integrated Mitotic Stem Cell
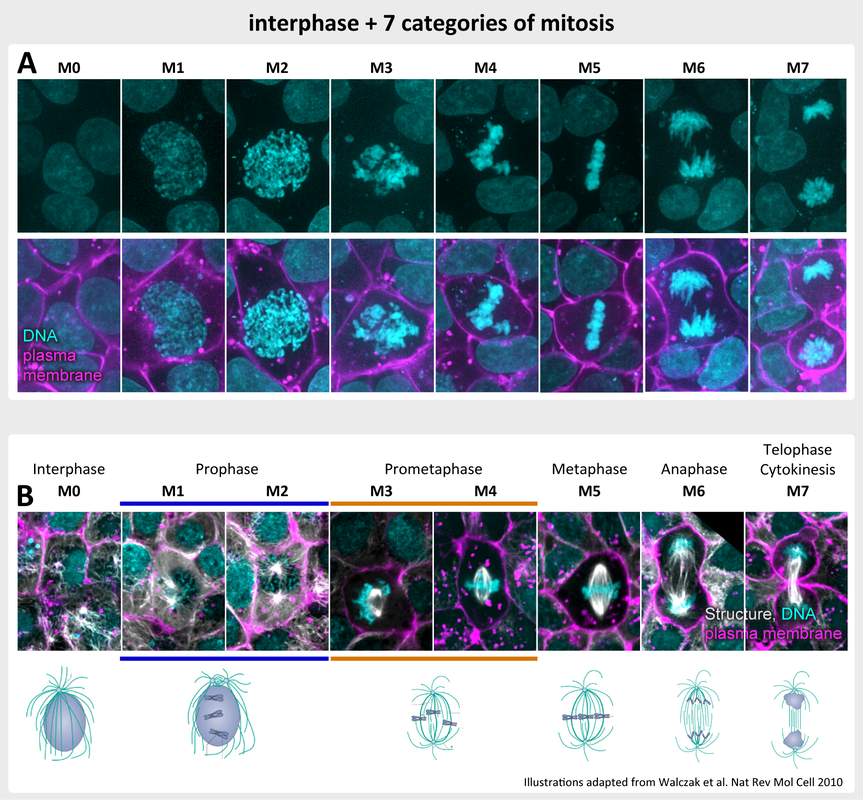
Figure 1.
A. Representative examples of hiPS cells in seven stages of mitosis (M1-M7) and one category representing interphase (M0) categorized by shape and texture patterns of the DNA. Top row shows DNA and bottom row shows DNA and membrane.
B. Representative examples of hiPS cells expressing mEGFP-tagged alpha-tubulin in the same stages of mitosis as in A. Bottom row shows an illustration of mitosis stages as depicted in the listed reference. For both A and B live hiPS cells were labeled with NucBlue Live (DNA; cyan; maximum intensity projection) and CellMask Deep Red (cell membrane; magenta; single slice near middle of the cell) and imaged on a spinning-disk confocal microscope.
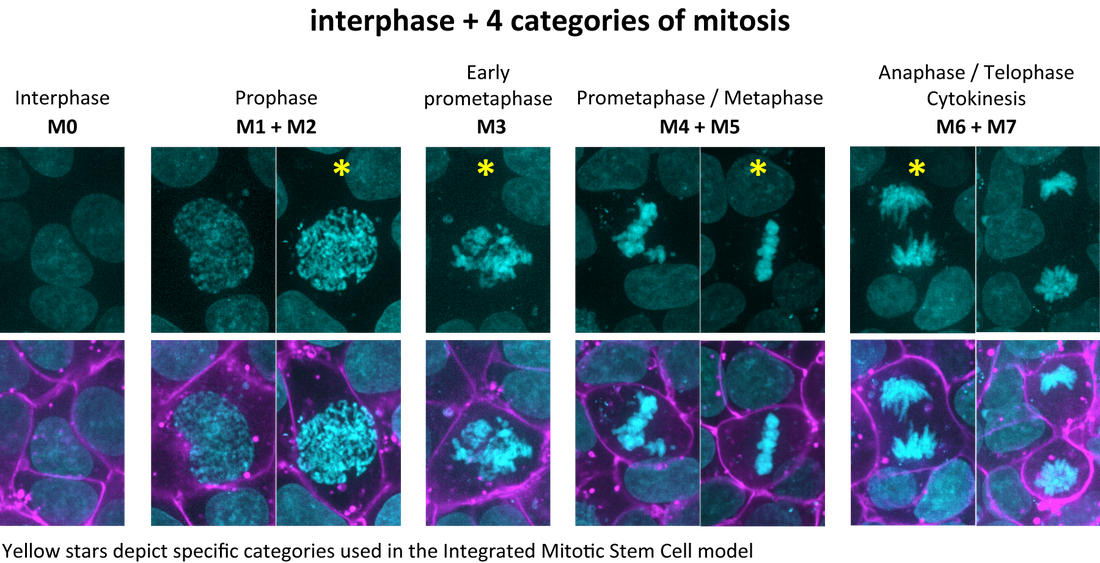
Figure 2. Representative examples of hiPS cells from Figure 1 to demonstrate the transformation of seven categories of mitosis into four. These four categories plus interphase were used to classify all available cells in the Allen Cell Collection. For the Integrated Mitotic Stem Cell Model, representative cells were selected at specific points within the range of each of the four stages, indicated with a star. For example, while prometaphase/metaphase (M4+M5) is one mitotic category, for the Integrated Mitotic Stem Cell model, only cells clearly at metaphase (M5) were used.
Assigning mitotic cells to 4 mitotic categories
Mitotic cell datasets description
Automated alignment of cells
To align cells within each of the five cell cycle categories (four mitotic and one interphase), we created an automatic algorithm to identify 1) the translation needed to align the centroids of the DNA in three dimensions and 2) the two-dimensional rotation needed to align the cell within that stage of mitosis to a two-dimensional reference cell.
- hiPS cells were initially manually categorized into seven stages of mitosis based on the appearance (shape and texture) of the fluorescence signal of the DNA labeled with NucBlue Live (M0-M7, Figure 1). These categories were not selected based on prior biological knowledge of standard mitotic stages. However, examination of categorized hiPS cells expressing mEGFP-tagged alpha-tubulin (Figure 1B) showed that there is a good correspondence between the categories and the canonical mitotic stages including prophase, prometaphase, metaphase, anaphase, telophase and cytokinesis. In addition, non-mitotic cells were considered as one ensemble interphase stage.
- These eight (seven stages of mitosis plus interphases) categories were used for manual annotation of ~700 mitotic cells from the Allen Cell Collection. These cells represented data from 14 gene-edited clonal hiPSC cell lines with fluorescent proteins localized to major cellular structures.
- Based on this set of manual annotations of eight categories, a machine-learning classifier was trained (see this document). Both this classifier and further manual annotation revealed that identifying the boundaries between the seven mitotic categories was often difficult due to the continuous nature of the process of mitosis and thus of the appearance of the DNA. To facilitate both manual and automated classification at a larger scale, the seven mitotic categories were transformed into four mitotic categories (Figure 2). The final four mitotic categories corresponded to prophase (M1+M2), early prometaphase (M3), prometaphase/metaphase (M4+M5), anaphase/telophase/cytokinesis (M6+M7). All ~1500 mitotic cells were classified into these four categories and are available on the Cell Feature Explorer page.
Mitotic cell datasets description
- All mitotic cells in the Allen Cell Collection were assigned to one of four mitotic categories. In addition all mitotic cells were aligned in an automated manner (see below for method details).
- A subset of the categorized and aligned cells was used to create the Integrated Mitotic Stem Cell model, consisting of one representative cell for each of the five categories (four mitotic + one interphase) for 15 cellular structures. This subset ws comprised of the following mitotic stages: mid-prophase, early prometaphase, metaphase, and anaphase/telophase. For this 75-cell data set, 80% of cells cells were automatically aligned and 20% of cells were further manually aligned to provide the best visual alignment for purposes of examining the cells and structures in an integrated manner. The results of this model are available on the Cell Feature Explorer page.
Automated alignment of cells
To align cells within each of the five cell cycle categories (four mitotic and one interphase), we created an automatic algorithm to identify 1) the translation needed to align the centroids of the DNA in three dimensions and 2) the two-dimensional rotation needed to align the cell within that stage of mitosis to a two-dimensional reference cell.
- Translation of cells to align centroids of DNA in three dimensions
We identified the centroid of the DNA based on the 3-dimensional bounding box of the DNA fluorescent channel segmentation. This centroid was used to translate all cells into the same position in xyz space. - Creating a reference cell template for rotating cells within each mitotic category + interphase
For all cells we created 2-dimensional cell membrane contours based on the center slice of the z-stack of the cell and 2-dimensional DNA contours based on the maximum intensity projection of the DNA-channel z-stack. All cells within a given mitotic category were visually inspected and the most “average” cell based on both cell and DNA contour was selected as the reference cell for that cell stage. Each of these reference cells was then rotated in two dimensions such that the longest axis of the DNA contour became vertical, except for the prophase reference cell, in which the cell was aligned such that the longest cell contour axis became horizontal. - Automated rotation of cells in two dimensions within each mitotic category + interphase
Cells that were aligned via their DNA centroid (see 1.) were rotated based on either the DNA or their cell boundary contours depending on their specific cell cycle category. For cells in interphase and prophase, the alignment contour was based on the two-dimensional cell membrane contour of the center slice of the z-stack of the cell. For cells in metaphase and anaphase, the alignment contour was based on the two-dimensional maximum intensity projection of the z-stack corresponding to the DNA. For cells in early prometaphase, the alignment contour was generated using one of the two techniques just described depending on the eccentricity of the largest connected component of the DNA. For instance, if that value were below 0.55 the cell would be aligned similar to cells in interphase and prophase; however, if the eccentricity exceeded 0.55, indicating a preferential direction for DNA, the cell would be aligned similar to cells in metaphase and anaphase. This ensured the best alignment performance given that the DNA shape of early prometaphase cells did not always align well. Any cells near the border of the field of view were padded with zeros after the rotation.
Cells were rotated in two dimensions based on the distance between the alignment contour of the reference cell (cell A; see point 2 above) and the alignment contour of any given cell (cell B). This distance metric is the average minimum distance between points (x,y) of cell A to the points (x,y) in cell B. The algorithm outputs the angle from 0 to 360 degrees that minimizes the distance between cell A and cell B. Cells were then rotated around their DNA centrioid by this angle. - Manual fine-tuning of alignment
The automatic rotation algorithm effectively aligned 80% of the 75 cells used in the Integrated Mitotic Cell model. However, in 20% of cells large regions did not overlay with other aligned cells. To circumvent this, we manually adjusted the rotation angle for the cell by taking into account three-dimensional information as well as what is known about the co-localization of the labeled structure in the given cell and the structures in the aligned cells of the same mitotic stage.
An integrated view of the cell at each stage of mitosis
For each cell line and mitotic stage category, all assigned cells were examined for the location and morphology of the intracellular structure. One representative example of each is shown in Figure 3 below, as well as in the 3D Visual Summary tool. To simplify the presentation in the 3D Visual Summary tool, several of these mitotic categories were removed and the remaining categories were named after canonical mitotic stages.
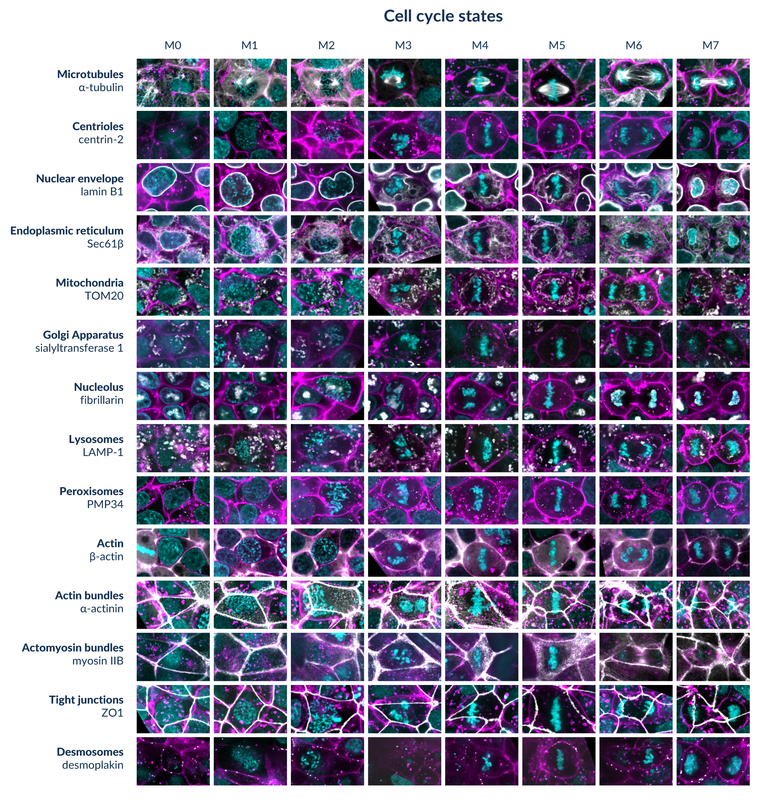
Figure 3. Representative examples of hiPS cells expressing 14 different FP-tagged intracellular structures (listed on left, more information in the Cell Catalog) in seven stages of mitosis and one stage of interphase categorized by shape and texture patterns of the DNA. Live hiPS cells were labeled with NucBlue Live (DNA; cyan;) and CellMask Deep Red (cell membrane; magenta) and imaged on a spinning-disk confocal microscope. Cells were rotated to align the axis of cell division.
For any given structure, general changes in localization of the protein and the intracellular structure it represents can be followed through mitosis (Figure 3 left to right columns within one row). In addition, for any given mitotic stage, the combined set of structure localizations can be examined (Figure 3 all rows within one column), thereby creating an integrated view of the cell at each stage of mitosis.
Some interesting observations include:
- reorganization of microtubules to form the mitotic spindle and segregate the chromosomes, validating the DNA appearance-based classification.
|
Z-stack of microtubules visualized via α-tubulin during M5
|
Z-stack of microtubules visualized via α-tubulin during M7
|
- reorganization of the nuclear envelope: lamin B1 associates with the peripheral ER during interphase and with the ER more generally during mitosis, including nuclear invaginations after cell division. These observations are based on close examination of patterns of both lamin B1 and Sec61B during mitosis.
|
Z-stack of nuclear envelope visualized via lamin B1 during M0
Z-stack of endoplasmic reticulum visualized via Sec61ß during M0
|
Z-stack of nuclear envelope visualized via lamin B1 during M5
Z-stack of endoplasmic reticulum visualized via Sec61ß during M5
|
Z-stack of nuclear envelope visualized via lamin B1 during M7
Z-stack of endoplasmic reticulum visualized via Sec61ß during M7
|
- fragmentation and disassembly of Golgi and redistribution of sialyltransferase 1 before cell division followed its reassembly to form the Golgi after cell division.
|
Z-stack of Golgi visualized via sialyltransferase 1 during M5
|
Z-stack of Golgi visualized via sialyltransferase 1 during M7
|
- disassembly of the nucleolus and redistribution of fibrillarin. Disassembly includes a stage where the nucleolus seems to ‘melt’. Reassembly occurs around the chromosomes after cell division.
|
Z-stack of nucleolus visualized via fibrillarin during M5
|
Z-stack of nucleolus visualized via fibrillarin during M7
|
- redistribution of mitochondria to surround the mitotic spindle during cell division.
|
Z-stack of mitochondria visualized via TOM20 during M5
|
Z-stack of mitochondria visualized via TOM20 during M7
|
- structures that do not change their localization during most of mitosis include many of the structures localized to and representing the cell-cell contacts near the apical side of the hiPS cells, permitting cells to maintain their position within the colony during cell division.
|
Z-stack of tight junctions visualized via ZO1 during M0
|
Z-stack of tight junctions visualized via ZO1 during M6
|