Allen Cell Explorer
  • About
    • What We Do
    • FAQs
    • Videos & Tutorials
    • Site Updates
    • < Forum >
    • < AllenInstitute.org >
  • Animated Cell
    • Educational Resources
    • Visual Guide to Human Cells
    • Visual Guide Tutorial
    • Research Projects >
      • Pathtrace rendering
  • Cells & Biology
    • Cell Catalog
    • About our Cells >
      • hiPS Cell Biology Overview
      • Cell Structure Observations
      • Cell Catalog QuickView
    • Genomics
    • Methods & SOPs >
      • Methods for Cells in the Lab
      • Cell Methods: Videos from the Lab
      • Methods for Microscopy
    • Research Projects >
      • hiPS Cells During Mitosis
      • Drug Perturbation Pilot
      • Differentiation Into Cardiomyocytes
      • Why Endogenous Tagging?
  • Data & Tools
    • Cell Catalog
    • 3D Cell Viewer
    • Cell Feature Explorer
    • Integrated Mitotic Stem Cell Z-stack Viewer
    • Deep Cell Zoom
    • Segmenter
    • Data Downloading
    • Software & Code
    • Simularium
    • Research Projects >
      • Extracting Information
  • Modeling & Analysis
    • Integrated Mitotic Stem Cell
    • Allen Integrated Cell
    • Label-free Determination
    • Data Notebook Exploration >
      • Cell Shape Analysis
      • Programmatic Data Access
    • Research Projects >
      • 3D Probabilistic Modeling
  • News & Publications
    • News Feed
    • Publications
    • Archived Content

Instructional Videos & Tutorials
​for Animated Cell Tools

Tutorial: Visual Guide to Human Cells

For an interactive overview of hiPS cell 3D structure & function

Learn the biology of human induced pluripotent stem cells

The Visual Guide to Human Cells web page organizes information about human induced pluripotent stem cells into a curated collection of interactive models. You can rotate and zoom into 3D cells, each segmented from real data for each phase of mitosis, while learning more about individual cell structures and functions.

Illustrated cell structures...

illustration of ER simulated point spread image
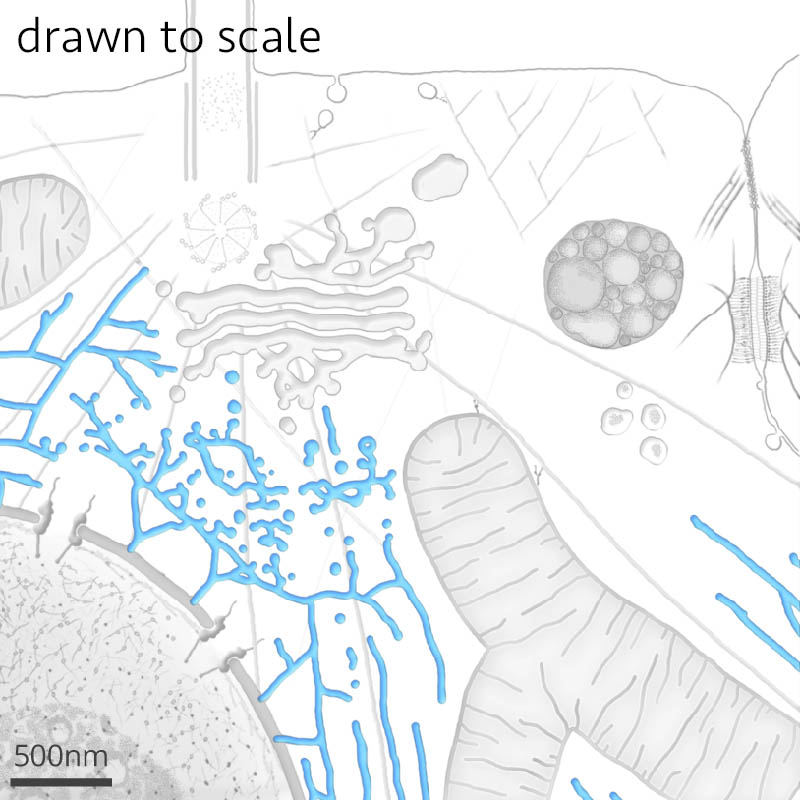
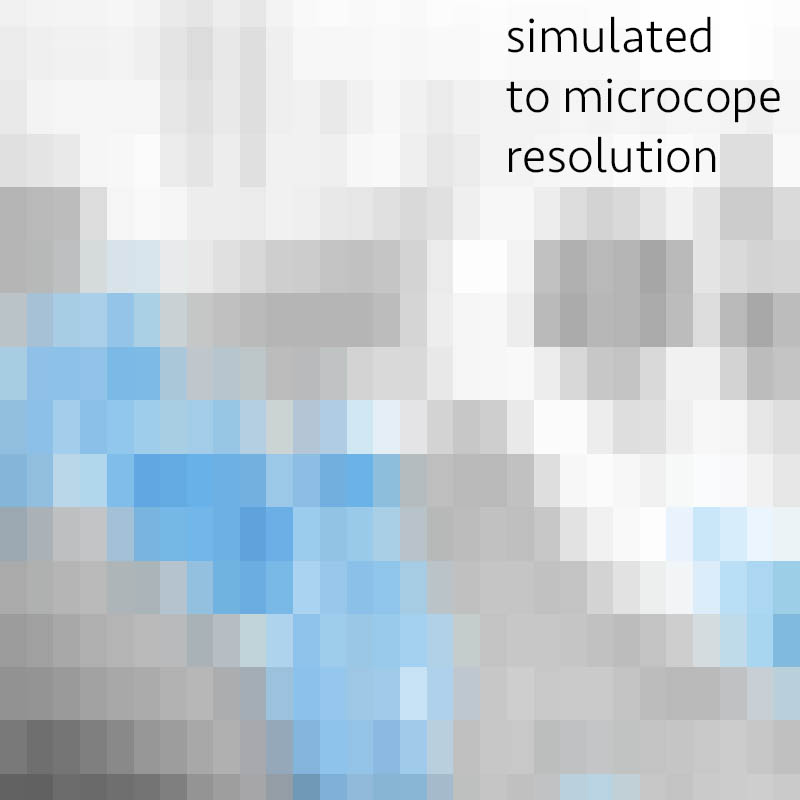
3D representations of the cells are shown in the Visual Guide as interactive solid models displayed at the resolution of the spinning disc 3D confocal microscopy data we generate at the Institute. Each of these models has different colored surfaces used to display boundaries for major cellular structures. The shapes and location of these surfaces come from 3 different sources and can be confusing for first-time users who know a lot about cell structures such as microtubules, mitochondria and Golgi.

​Move the slider on this image to gain a better understanding of why we can't easily distinguish cisternae of the endoplasmic reticulum illustrated here in blue, and why microtubules look more like a “blobby web” of tall tubes ~300nm in diameter instead of distinct fibers that are known to be ~25nm in diameter.

1. Explore the integrated 3D model

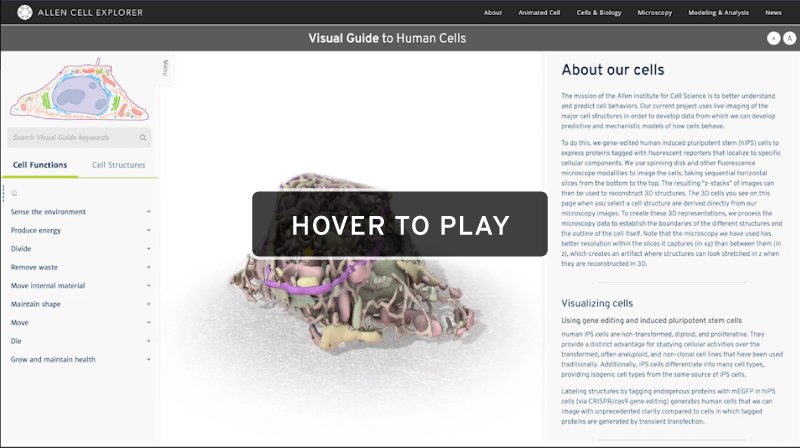
Visit allencell.org/visual-guide-to-human-cells.html

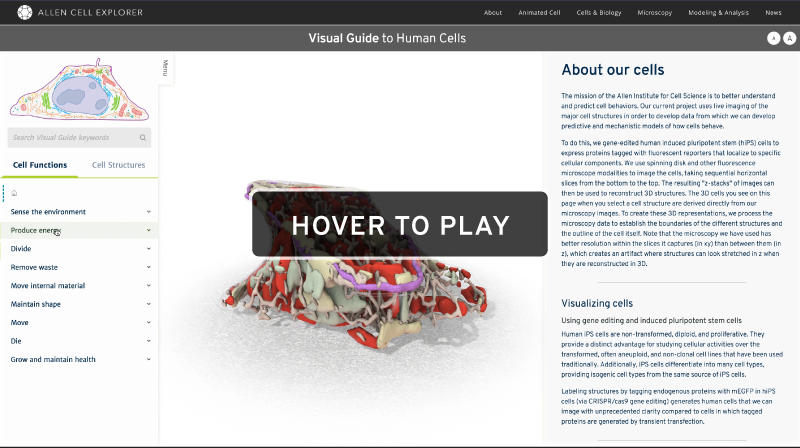
Once the Visual Guide home page loads, you can immediately explore the 3D cell that shows up in the middle of the page:
  • rotate the cell = left mouse click & drag
  • zoom = middle mouse click & drag, mouse wheel, pinch
  • pan = right mouse (or click & drag with two fingers on a trackpad)
  • hover over any 3D shape to reveal the name of the structure
Click on the AA to adjust the font size if needed.

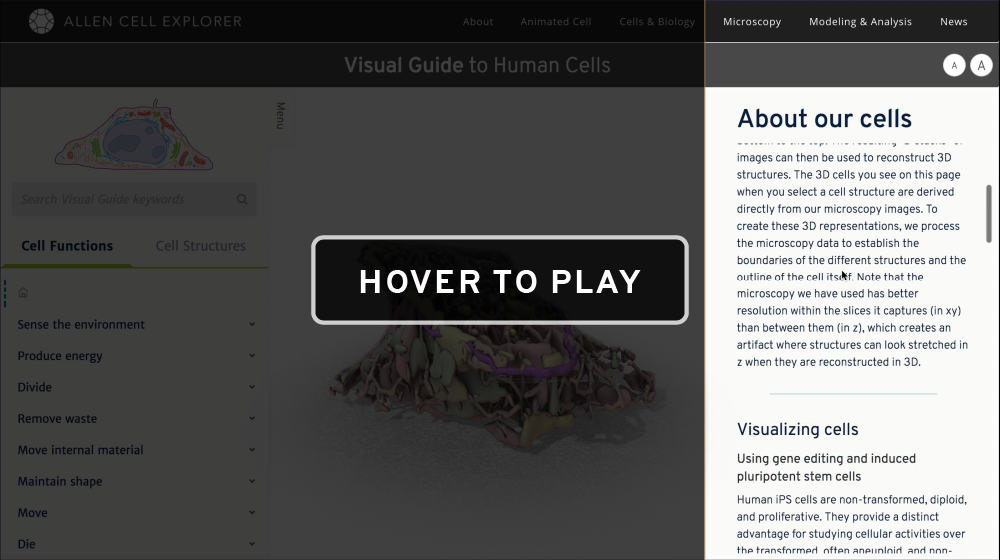
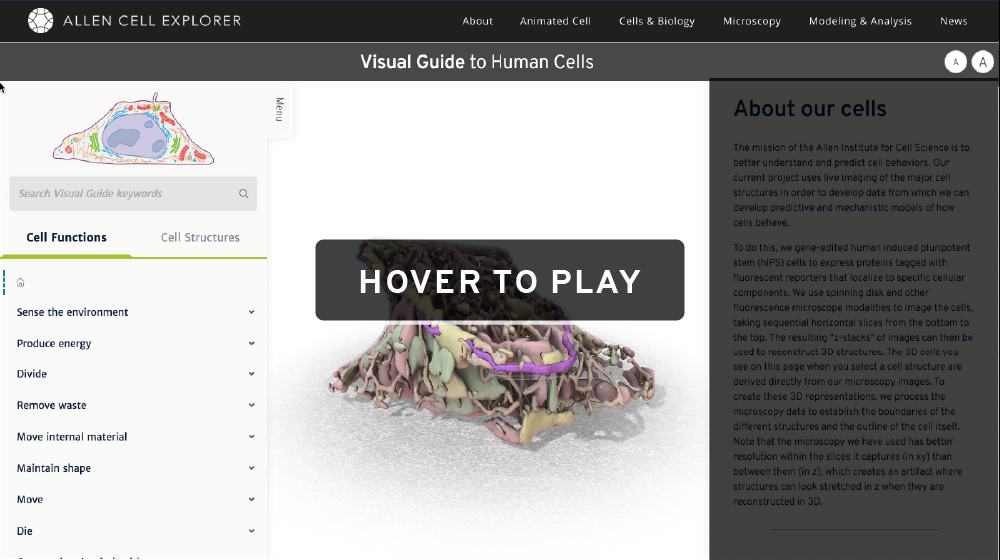
2. Read more about our cells & science in the information panel

Scroll through the details in the information panel to learn details about the 3D cell you just rotated, and to better understand how we use gene-editing to see different structures inside our cells.

Important: You can enlarge any visual content by clicking on the ⤢ icon available in the upper-right corner of its section.

3. Browse & search content using the menu panel

The menu panel provides tools to quickly navigate through dozens of other interactive 3D cells and information panels. This panel is divided into 3 major sections, from top to bottom:

  • Visual map highlights any structures selected in the current 3D model
  • Search bar allows quick searching for specific words available in the Cell Function/Structure hierarchies
  • Cell Function/Structure lists provide hierarchical lists of the available content pages for explorative navigation
Hover over each of the words in the Cell Function and Cell Structure lists to highlight related structures in the 3D model with brighter colors. Hovering is not available for touch screens at this time.

4. Explore the cells through cellular functions

Click on Produce Energy under the Cell Function list.
  • The list immediately unfurls to reveal a list of the major structures that are heavily involved in the process of producing energy.
  • The 2D map colorizes only the structures found in the unfurled list.
  • Content in the information panel changes to describe the cell biology of energy production in eukaryotic cells as a process of transferring energy stored in food that the cell consumes into a more universal molecule called ATP.
  • Navigation breadcrumbs change to reveal that you are viewing the ⌂/Produce Energy related content

5. Select a specific structure to learn more about it

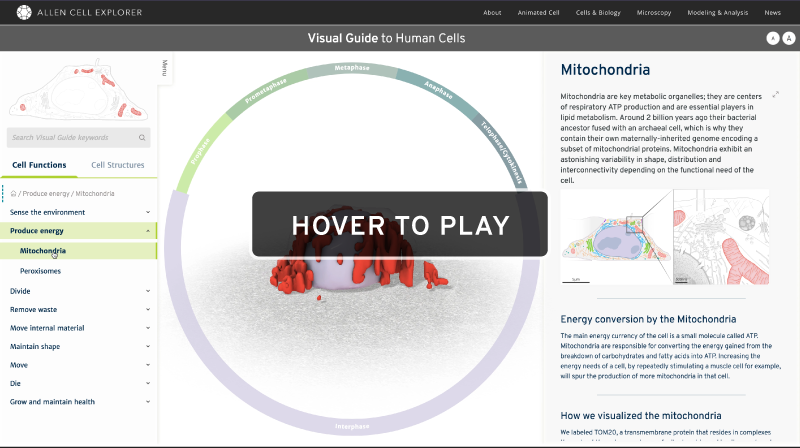
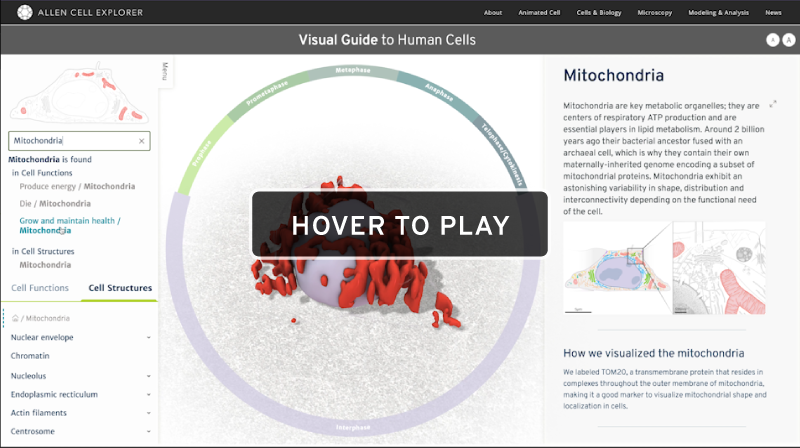
Click on Mitochondria under the Cell Function list.
  • The 2D map colorizes only the selected structure (mitochondria in this case).​
  • Navigation breadcrumbs change to reveal that you are viewing the ⌂/Produce energy/Mitochondria related content.
  • The 14 structure 3D illustrated ⌂ "home" cell model updates to an interphase cell with only 3 visible structures to display the cell membrane, DNA, and the GFP-tagged structure selected in the hierarchy (mitochondria in this case), which are generated directly from the data collected at the Institute.
  • A circle of buttons representing major phases of the cell cycle appears around the 3-structure cell. The interphase button is selected and the mitochondrial cell shown in the center from data of an interphase cell.
  • Content in the information panel changes to describe the general functions and cellular structure of mitochondria. It focuses primarily on function.
  • You can also click on Mitochondria from under the Cell Structures list to reveal content more specific to the structure of mitochondria.

6. View cells in each stage of mitosis

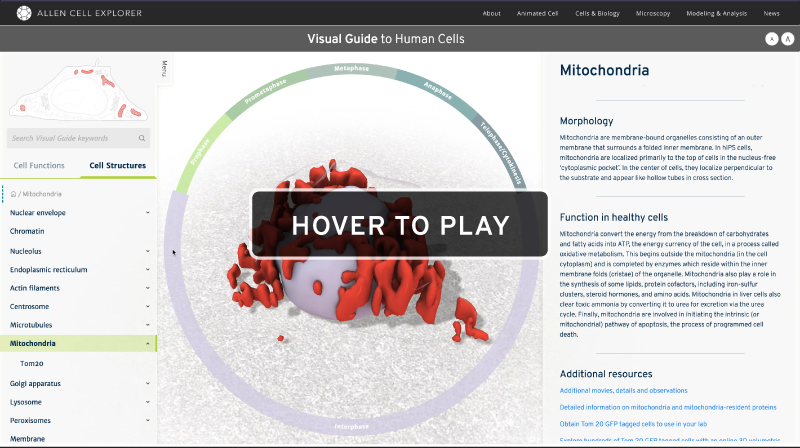
A circle of buttons representing major phases of the cell cycle sit around the 3-structure cell. The interphase button is selected by default to reveal an interphase cell.

Click on Prophase.  The interphase cell changes to a prophase cell. Click through all the phases of mitosis.

7. Read more about the structure & our science in the information panel

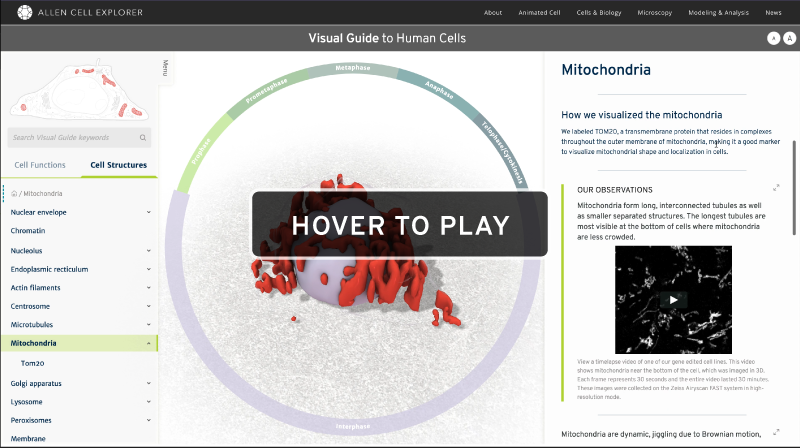
Scroll through the information panel to learn details about the particular structure you selected and to view time-series movies of that structure undergoing cell growth and division collected from our microscopes.

Important: You can enlarge any visual content by clicking on the ⤢ icon available in the upper-right corner of its section.
​

Click on the AA to adjust the font size if needed.

8. Search the menu panel

The Search bar allows quick searching for specific words available in the Cell Function/Structure hierarchies.

Type mito to reveal where the word mitochondria can be found. There are 3 Cell Functions and 1 Cell Structure listed.
When you finish with mitochondria, use the navigation menu to explore the other structures we have imaged inside of hiPS cells at the Allen Institute for Cell Science.

More instructional videos & tutorials for Animated Cell tools coming soon

Home

Terms of Use

Citation Policy

Privacy Policy

FAQs

Help

Send us a message

Copyright © 2020 Allen Institute. All Rights Reserved.
cellscience.alleninstitute.org
  • About
    • What We Do
    • FAQs
    • Videos & Tutorials
    • Site Updates
    • < Forum >
    • < AllenInstitute.org >
  • Animated Cell
    • Educational Resources
    • Visual Guide to Human Cells
    • Visual Guide Tutorial
    • Research Projects >
      • Pathtrace rendering
  • Cells & Biology
    • Cell Catalog
    • About our Cells >
      • hiPS Cell Biology Overview
      • Cell Structure Observations
      • Cell Catalog QuickView
    • Genomics
    • Methods & SOPs >
      • Methods for Cells in the Lab
      • Cell Methods: Videos from the Lab
      • Methods for Microscopy
    • Research Projects >
      • hiPS Cells During Mitosis
      • Drug Perturbation Pilot
      • Differentiation Into Cardiomyocytes
      • Why Endogenous Tagging?
  • Data & Tools
    • Cell Catalog
    • 3D Cell Viewer
    • Cell Feature Explorer
    • Integrated Mitotic Stem Cell Z-stack Viewer
    • Deep Cell Zoom
    • Segmenter
    • Data Downloading
    • Software & Code
    • Simularium
    • Research Projects >
      • Extracting Information
  • Modeling & Analysis
    • Integrated Mitotic Stem Cell
    • Allen Integrated Cell
    • Label-free Determination
    • Data Notebook Exploration >
      • Cell Shape Analysis
      • Programmatic Data Access
    • Research Projects >
      • 3D Probabilistic Modeling
  • News & Publications
    • News Feed
    • Publications
    • Archived Content