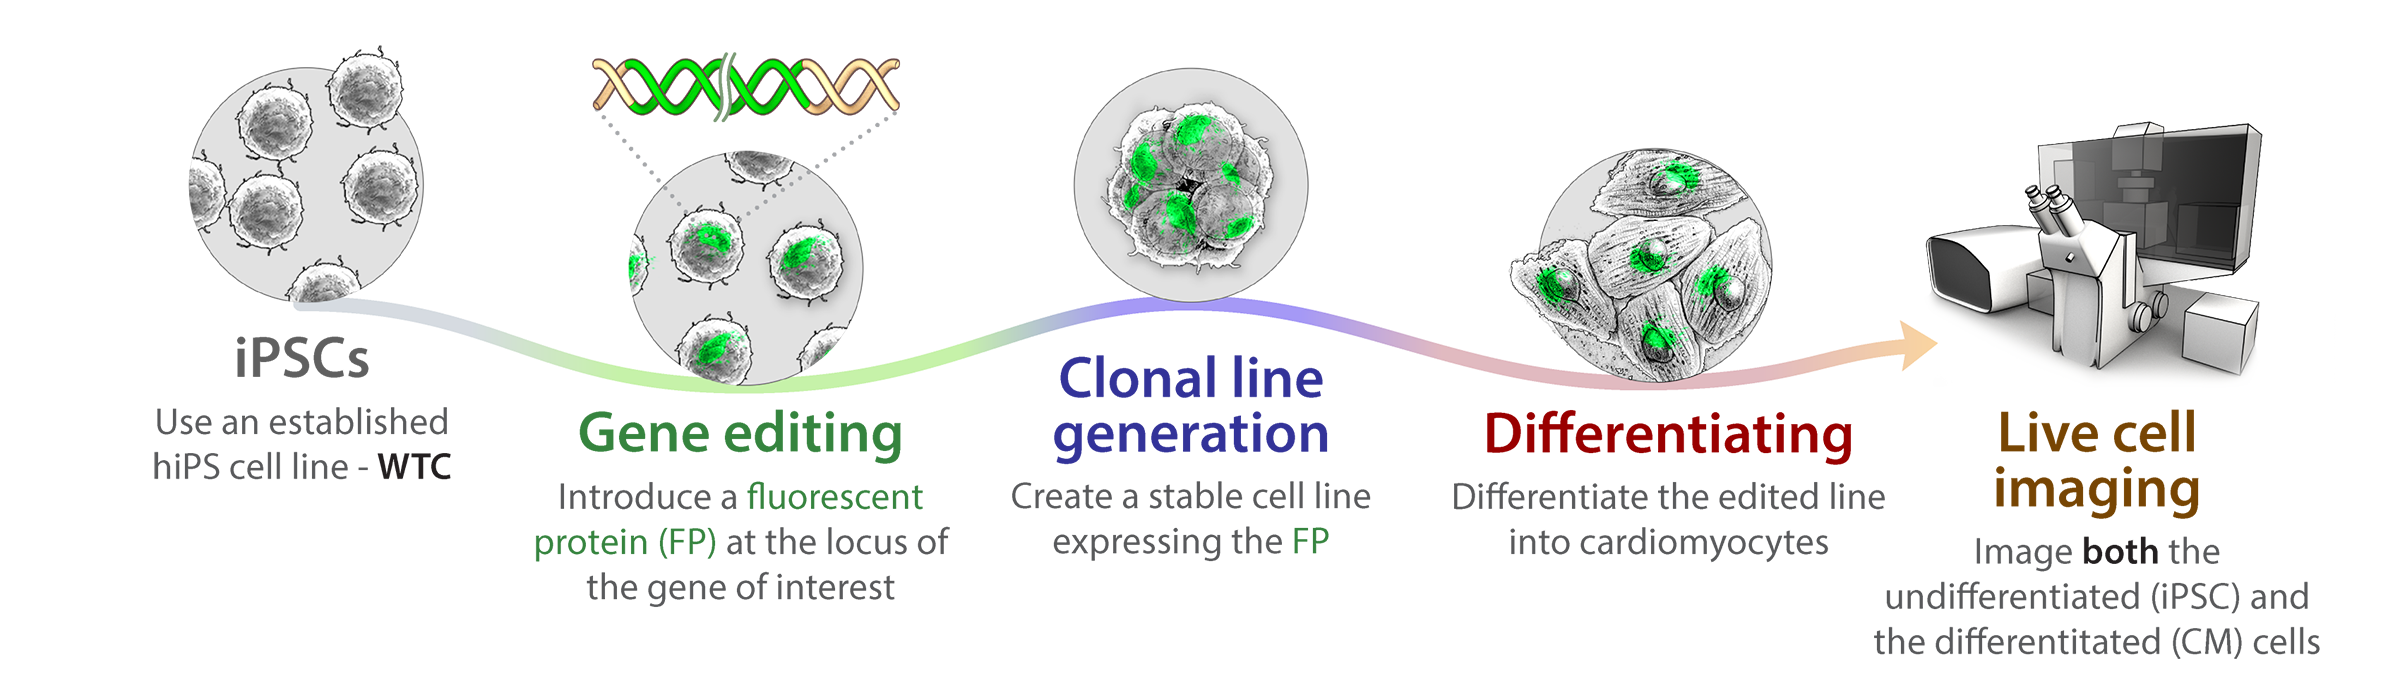
Overview
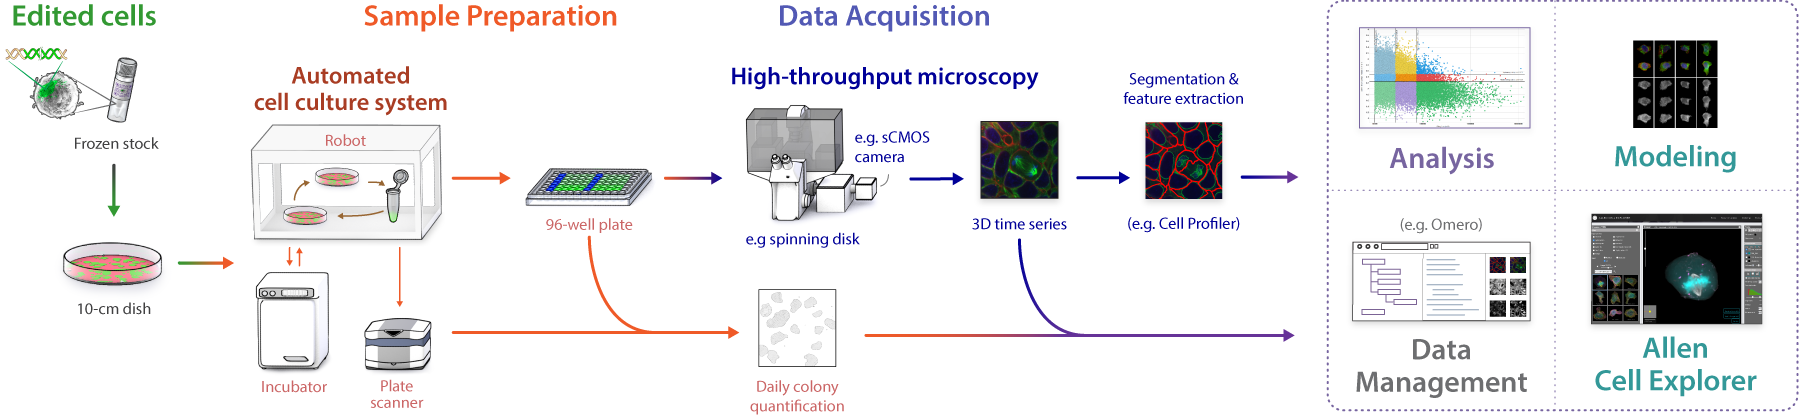
Using new gene editing technology, we are able to tag and mutate genes with greater precision than ever before, creating stable cell lines endogenously expressing markers in discrete proteins associated with major cellular structures and organelles. We can then induce these cells to become any kind of cell through various differentiation steps, carrying with them through their journey these unique markers. This allows us to use live cell imaging approaches to make valuable observations about cell organization and activities as the cell divides and replicates prior to specializing toward any particular lineage, and then as it goes through terminal differentiation to a mature specialized cell type. How the cell repurposes an essentially finite set of tools into an array of specialized systems to serve the unique purposes of each cell type then begins to emerge. Using specialized 3D analysis approaches in conjunction with modeling and machine learning approaches, we can integrate the information we are generating into an interactive 3D animation based on data from studies in real cells. These lines and the analysis and modeling approaches will be available to the community as part of our open access policy.
Gene editing, molecular and cellular biology
Cell reprogramming
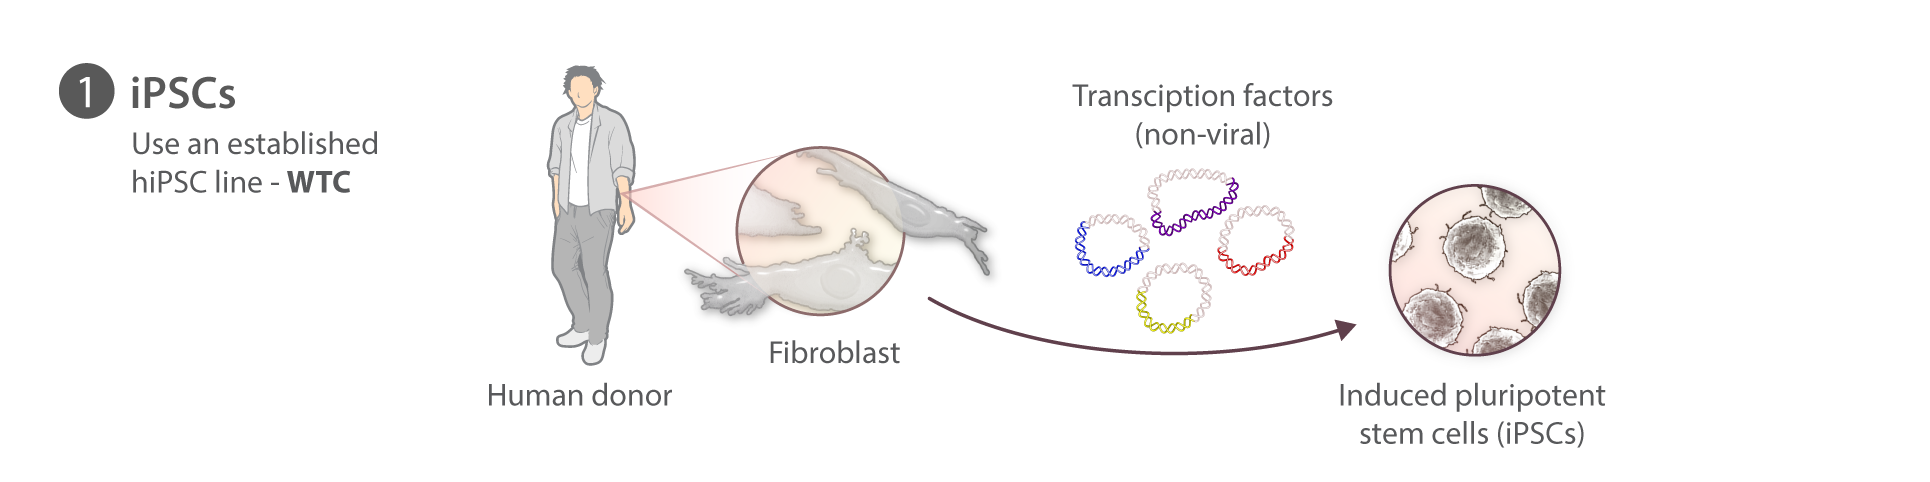
At the Allen Institute for Cell Science, we are not reprogramming our own iPSCs. For this first set of gene edited cell lines we have used the WTC parental line which was generously provided by Bruce Conklin at the Gladstone Institutes. This line was derived episomally from a healthy donor and has been fully sequenced, has a normal karyotype, differentiates into multiple cell types, and is amenable to gene editing. We are also able to make it available to the research community and sequence its genome: properties shared by few other lines of which we know.
At the Allen Institute for Cell Science, we are not reprogramming our own iPSCs. For this first set of gene edited cell lines we have used the WTC parental line which was generously provided by Bruce Conklin at the Gladstone Institutes. This line was derived episomally from a healthy donor and has been fully sequenced, has a normal karyotype, differentiates into multiple cell types, and is amenable to gene editing. We are also able to make it available to the research community and sequence its genome: properties shared by few other lines of which we know.
Cell culture
WTC hiPSCs are cultured in a feeder-free system on tissue culture dishes or plates coated with GFR Matrigel (Corning) diluted 1:30 in cold DMEM/F12 (Gibco). Undifferentiated cells are maintained with mTeSR1 media (STEMCELL Technologies) supplemented with 1% (v/v) Penicillin-streptomycin (P/S) (Gibco). Cells are not allowed to reach confluency greater than 85% and are passaged every 3-4 days by dissociation into single-cell suspension using StemPro® Accutase® (Gibco). When in single cell suspension, cells are counted using a Vi-CELL® Series Cell Viability Analyzer (Beckman Coulter). After passaging, cells are re-plated in mTeSR1 supplemented with 1% P/S and 10 µM ROCK inhibitor (Stemolecule Y-27632, Stemgent) for 24 h. Media is replenished with fresh mTeSR1 media supplemented with 1% P/S daily. Cells are maintained at 37˚C and 5% CO2. For further information, read about our Standard Operating Procedures for WTC culture.
WTC hiPSCs are cultured in a feeder-free system on tissue culture dishes or plates coated with GFR Matrigel (Corning) diluted 1:30 in cold DMEM/F12 (Gibco). Undifferentiated cells are maintained with mTeSR1 media (STEMCELL Technologies) supplemented with 1% (v/v) Penicillin-streptomycin (P/S) (Gibco). Cells are not allowed to reach confluency greater than 85% and are passaged every 3-4 days by dissociation into single-cell suspension using StemPro® Accutase® (Gibco). When in single cell suspension, cells are counted using a Vi-CELL® Series Cell Viability Analyzer (Beckman Coulter). After passaging, cells are re-plated in mTeSR1 supplemented with 1% P/S and 10 µM ROCK inhibitor (Stemolecule Y-27632, Stemgent) for 24 h. Media is replenished with fresh mTeSR1 media supplemented with 1% P/S daily. Cells are maintained at 37˚C and 5% CO2. For further information, read about our Standard Operating Procedures for WTC culture.
Donor plasmids, crRNAs & Cas9 protein
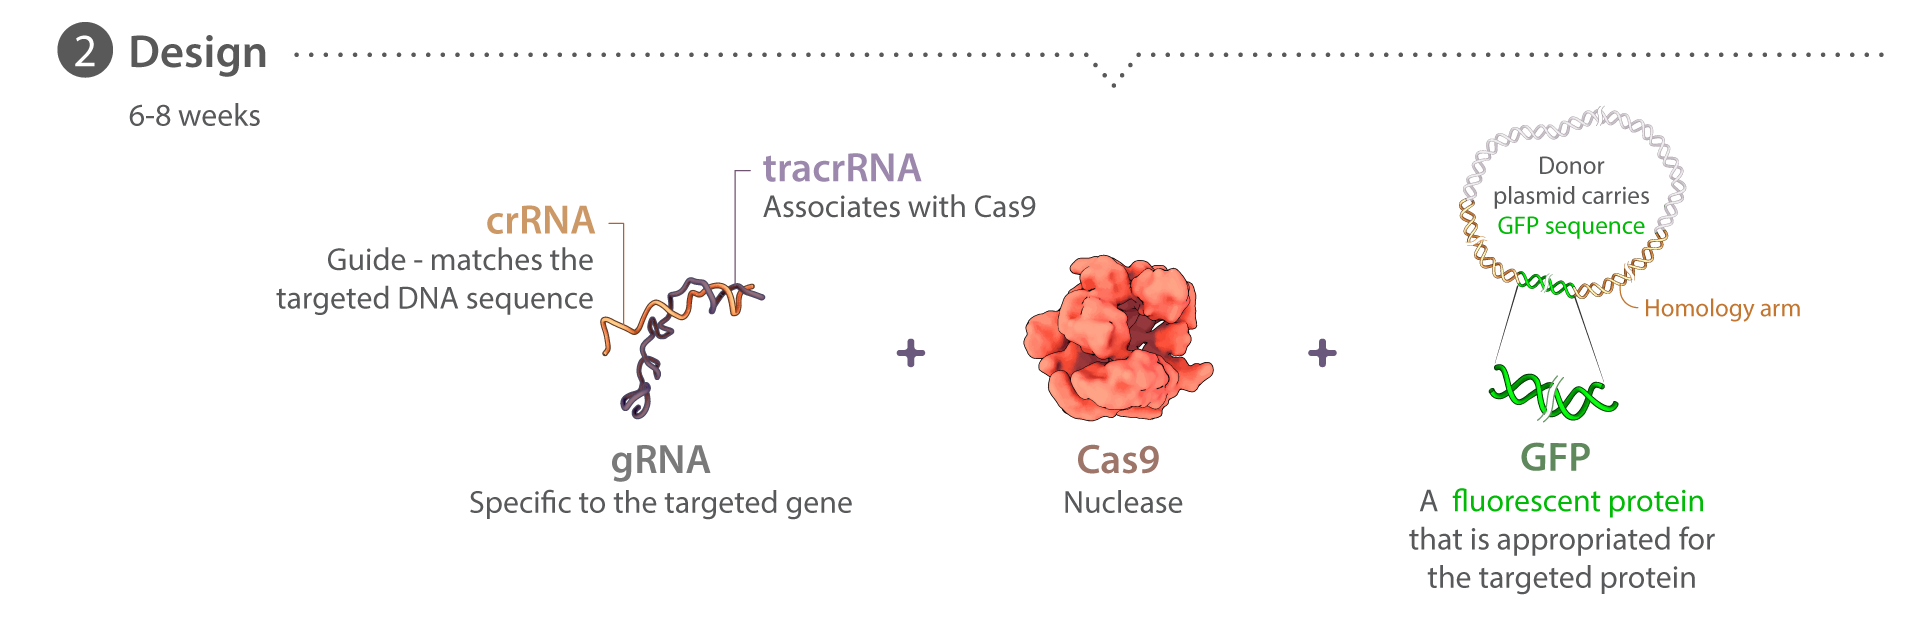
Donor plasmids are designed uniquely for each target locus, with each following a similar design strategy. Homology arms 5′ and 3′ of the desired insertion site are each 1 kb in length and designed from the GRCh38 reference genome, corrected for known WTC SNPs. Linkers for each protein are unique and are used to join the terminus of the protein with the mEGFP-encoding sequence (inserted 5′ of mEGFP for C-terminal tags and 3′ of mEGFP for N-terminal tags). To prevent crRNAs from targeting donor plasmid sequence, certain mutations are introduced to disrupt crRNA binding; when possible, these changes do not affect the amino acid sequence. All plasmids have been deposited at Addgene and are initially created either by In-Fusion (Clontech) assembly of gBlock pieces (IDT) into a pUC19 backbone, or are synthesized and cloned into a pUC57 backbone by Genewiz. Plasmid DNA for transfection is prepared using endotoxin-free purification kits (NucleoBond® Xtra Maxi EF, Clontech). Custom synthetic crRNAs and their corresponding tracrRNAs are ordered from either IDT or Dharmacon. Recombinant wild type S. pyogenes Cas9 protein is purchased from the UC Berkeley QB3 Macrolab. The majority of our tagging experiments use the mEGFP (K206A) sequence. Thus far PXN is the only one that used EGFP instead. Detailed information on editing design can be found in the online Cell Catalog.
Donor plasmids are designed uniquely for each target locus, with each following a similar design strategy. Homology arms 5′ and 3′ of the desired insertion site are each 1 kb in length and designed from the GRCh38 reference genome, corrected for known WTC SNPs. Linkers for each protein are unique and are used to join the terminus of the protein with the mEGFP-encoding sequence (inserted 5′ of mEGFP for C-terminal tags and 3′ of mEGFP for N-terminal tags). To prevent crRNAs from targeting donor plasmid sequence, certain mutations are introduced to disrupt crRNA binding; when possible, these changes do not affect the amino acid sequence. All plasmids have been deposited at Addgene and are initially created either by In-Fusion (Clontech) assembly of gBlock pieces (IDT) into a pUC19 backbone, or are synthesized and cloned into a pUC57 backbone by Genewiz. Plasmid DNA for transfection is prepared using endotoxin-free purification kits (NucleoBond® Xtra Maxi EF, Clontech). Custom synthetic crRNAs and their corresponding tracrRNAs are ordered from either IDT or Dharmacon. Recombinant wild type S. pyogenes Cas9 protein is purchased from the UC Berkeley QB3 Macrolab. The majority of our tagging experiments use the mEGFP (K206A) sequence. Thus far PXN is the only one that used EGFP instead. Detailed information on editing design can be found in the online Cell Catalog.
Transfection and enrichment by fluorescence-activated cell sorting (FACS)
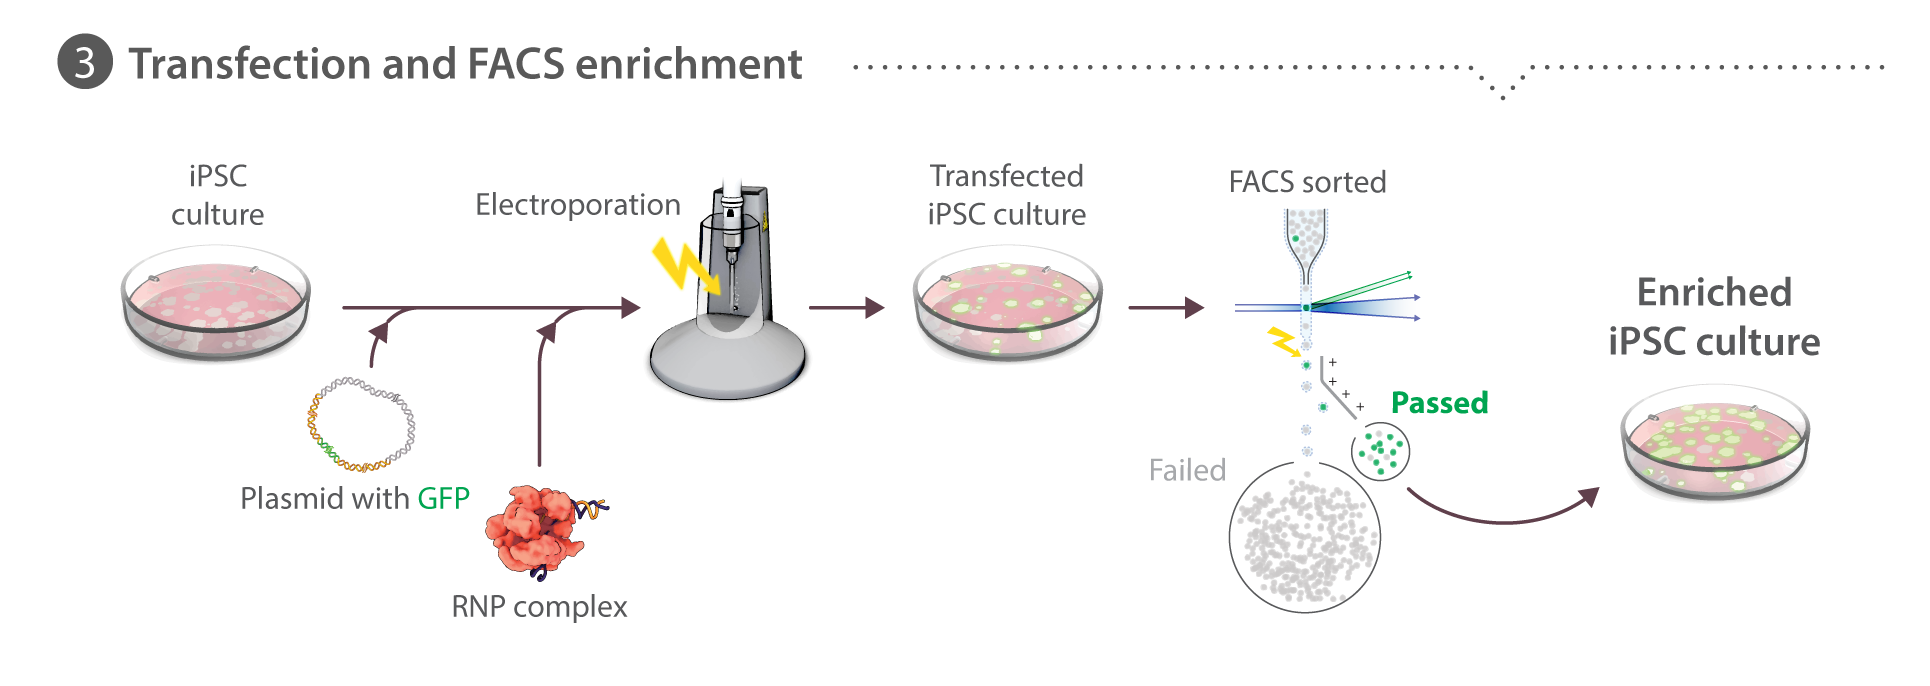
Cells are dissociated into single-cell suspension (see Cell culture above). Transfections are performed using the Neon transfection system (Life Technologies). We evaluated various delivery methods including CRISPRMAX (Thermo Fisher), GeneJuice (EMD Millipore), Amaxa (Lonza) and Neon (Thermo Fisher) and concluded that Neon electroporation resulted in favorable co-introduction of protein, RNA, and plasmid into hiPSCs as measured by transfection of a control reporter plasmid and T7 assays as a readout for Cas9 activity. Cas9:crRNA:tracrRNA pre-complexed 1:1:1 and co-transfected with 2 µg of donor plasmid optimally balanced editing efficiency with cell survival after transfection (data not shown) and thus this platform is used for all editing experiments. Learn about how we perform RNP transfection on our Standard Operating Procedures page.
Cells are dissociated into single-cell suspension (see Cell culture above). Transfections are performed using the Neon transfection system (Life Technologies). We evaluated various delivery methods including CRISPRMAX (Thermo Fisher), GeneJuice (EMD Millipore), Amaxa (Lonza) and Neon (Thermo Fisher) and concluded that Neon electroporation resulted in favorable co-introduction of protein, RNA, and plasmid into hiPSCs as measured by transfection of a control reporter plasmid and T7 assays as a readout for Cas9 activity. Cas9:crRNA:tracrRNA pre-complexed 1:1:1 and co-transfected with 2 µg of donor plasmid optimally balanced editing efficiency with cell survival after transfection (data not shown) and thus this platform is used for all editing experiments. Learn about how we perform RNP transfection on our Standard Operating Procedures page.
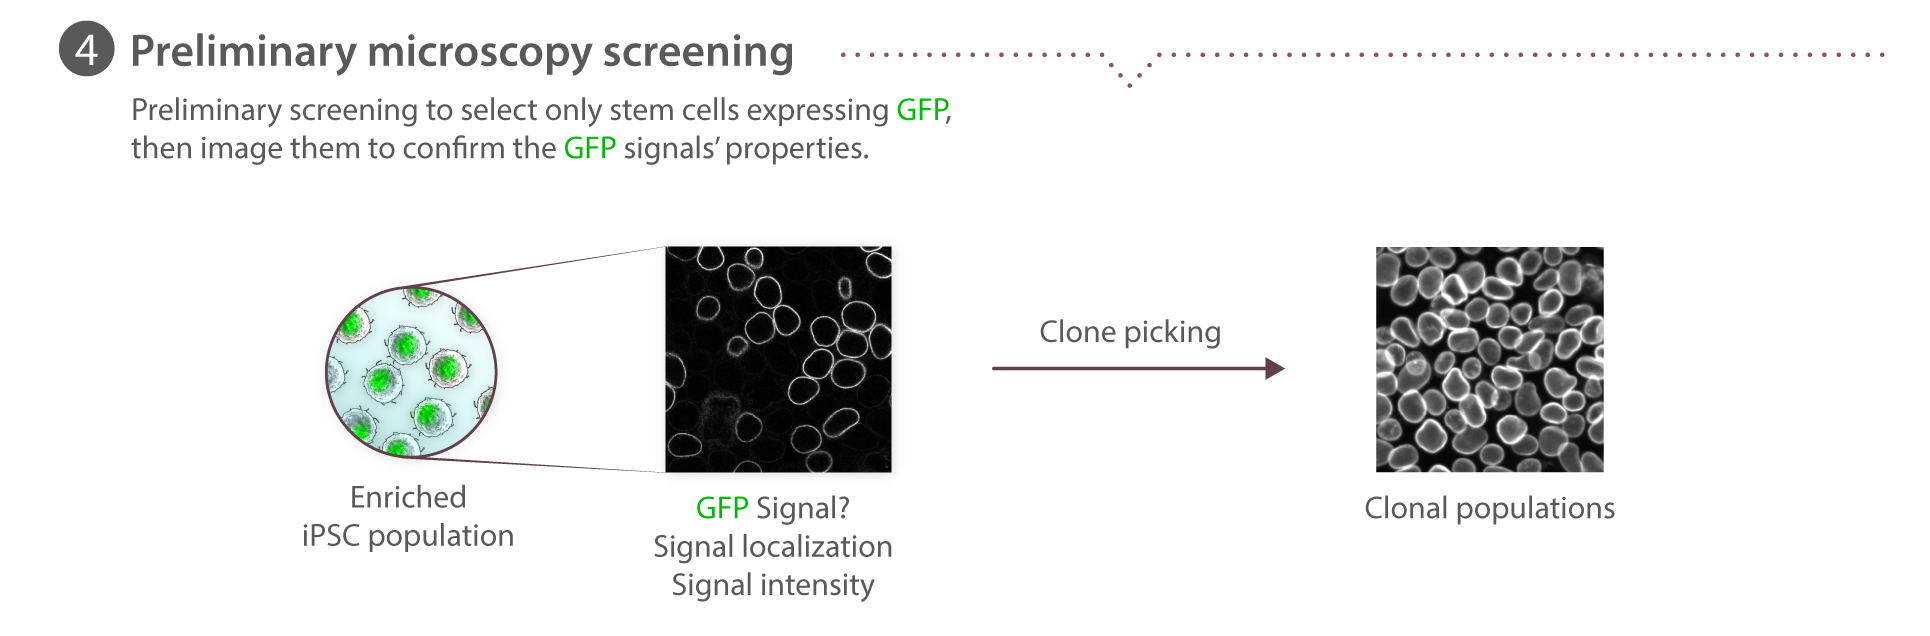
Cells (8x10⁵) are re-suspended in 100 µL Neon Buffer R with 2 µg donor plasmid, 2 µg Cas9 protein, and duplexed crRNA:tracrRNA in a 1:1 molar ratio to Cas9, pre-complexed for 10 minutes at room temperature, then electroporated with one pulse at 1300 V for 30 ms, and plated onto Matrigel-coated 6-well dishes with mTeSR1 media supplemented with 1% P/S and 10 µM ROCK inhibitor. Transfected cells are cultured as described above for 3-4 days until the transfected culture had recovered to ~70% confluence. Cells are harvested for FACS using Accutase, as described above. The cell suspension (0.5 – 1.0 x 10⁶ cells/mL in mTeSR1 + ROCK inhibitor) is filtered through a 35 µM mesh filter into polystyrene round bottomed tubes. Cells are sorted using a FACSAriaIII Fusion (BD Bioscience) with a 130 µM nozzle and FACSDiva software (BD Bioscience). Forward scatter and side scatter (height versus width) are used to exclude doublets and the GFP-positive gate is set using live, untransfected WTC cells such that <0.1% of untransfected cells fall within the gate. Sorted populations are plated into Matrigel-coated 96-well plates (<2 x 10³ cells recovered) or 24-well plates (<104 cells recovered) for expansion of the whole enriched population before clone picking. In some cases, (e.g. PXN), co-isolation of presumptively unedited cells is tolerated due to the weak GFP fluorescence intensity of tagged protein. To determine %HDR, data were analyzed using FlowJo V.10.2.
Cell plating for imaging
Cells were plated on glass bottom multi-well plates (P96-1.5H-N or P24-1.5H-N, Cellvis) coated with phenol red-free GFR Matrigel (356231, Corning) diluted 1:30 in phenol red-free DMEM/F12 (11039021, Gibco). Cells were seeded at a density of 2.5x10³ in 96-well plates and 12.5x10³ to 18x103 on 24-well plates and fixed or imaged 3-4 days later. Learn how we plate cells for imaging on our Standard Operating Procedures page.
Live cell imaging
Cells were maintained with phenol red free mTeSR1 media (custom order, STEMCELL Technologies) one day prior to live cell imaging. Cells were imaged on a Carl Zeiss spinning disk microscope with a Carl Zeiss 20x/0.8 NA plan APOCHROMAT or 100x/1.25 W C-APOCHROMAT Korr UV Vis IR objective, a CSU-X1 Yokogawa spinning disk head, and Hammamatsu Orca Flash 4.0 camera. Microscopes were outfitted with a humidified environmental chamber to maintain cells at 37°C with 5% CO2 during imaging.
Clonal cell line generation
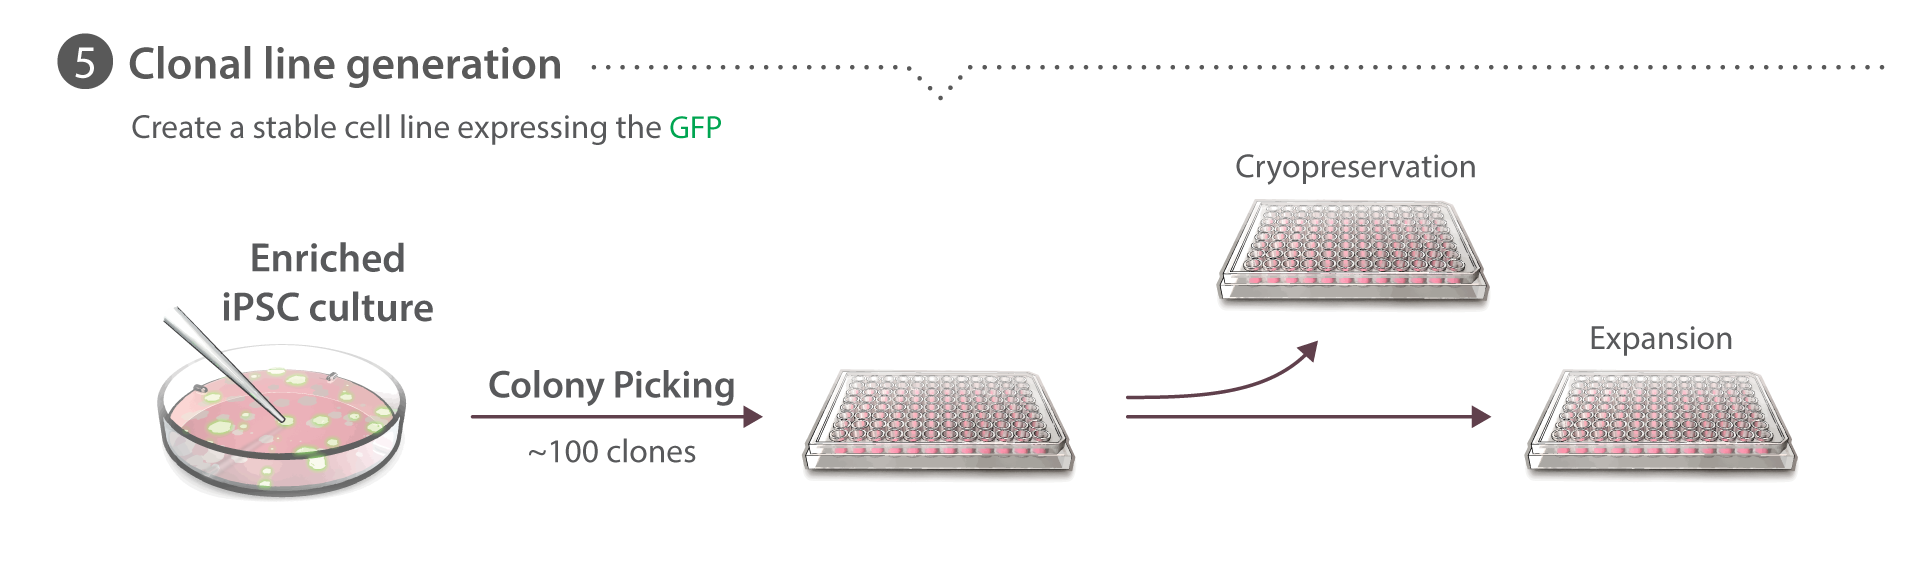
Cells from the FACS-enriched population are seeded at a density of 104 cells in a 10 cm Matrigel-coated tissue culture plate. After 5-7 days clones are manually picked with a pipette and transferred into individual wells of 96-well Matrigel-coated tissue culture plates and expanded clonally. We find >90% of these clones survive colony picking. After 3-4 days colonies are dispersed with Accutase and transferred into a fresh 96-well plate. After recovery, the plate is divided into plates for ongoing culture or freezing and gDNA isolation. To cryopreserve clones in 96-well format, when cells are 60-85% confluent, they are dissociated and pelleted in 96-well V-bottom plates. Cells are then re-suspended in 60 µL mTeSR1 supplemented with 1% P/S and 10 µM ROCK inhibitor. Two sister plates are frozen using 30 µL cell suspension per plate, added to 170 µL CryoStor® CS10 (STEMCELL Technologies) in non-Matrigel coated 96-well tissue culture plates. Plates are sealed with Parafilm and introduced to the -80˚C freezer in a room temperature Styrofoam box. Plates are stored long term at -80˚C for up to 8 weeks before thawing.
Cells from the FACS-enriched population are seeded at a density of 104 cells in a 10 cm Matrigel-coated tissue culture plate. After 5-7 days clones are manually picked with a pipette and transferred into individual wells of 96-well Matrigel-coated tissue culture plates and expanded clonally. We find >90% of these clones survive colony picking. After 3-4 days colonies are dispersed with Accutase and transferred into a fresh 96-well plate. After recovery, the plate is divided into plates for ongoing culture or freezing and gDNA isolation. To cryopreserve clones in 96-well format, when cells are 60-85% confluent, they are dissociated and pelleted in 96-well V-bottom plates. Cells are then re-suspended in 60 µL mTeSR1 supplemented with 1% P/S and 10 µM ROCK inhibitor. Two sister plates are frozen using 30 µL cell suspension per plate, added to 170 µL CryoStor® CS10 (STEMCELL Technologies) in non-Matrigel coated 96-well tissue culture plates. Plates are sealed with Parafilm and introduced to the -80˚C freezer in a room temperature Styrofoam box. Plates are stored long term at -80˚C for up to 8 weeks before thawing.
Genetic screening with ddPCR
During clone expansion, a sample of cells is pelleted for total gDNA extraction using the PureLink Pro 96 Genomic DNA Purification Kit (Life Technologies). ddPCR is performed using the Bio-Rad QX200 Droplet Reader, Droplet Generator, and QuantaSoft software. The reference assay for the 2-copy, autosomal gene RPP30 is purchased from Bio-Rad. The assay for mEGFP detection is as follows: primers (5′-GCCGACAAGCAGAAGAACG-3′, 5′-GGGTGTTCTGCTGGTAGTGG-3′) probe (/56-FAM/AGATCCGCC/ZEN/ACAACATCGAGG/3IABkFQ/). The assay for AMP is as follows: primers (5′- TTTCCGTGTCGCCCTTATTCC -3′, 5′- ATGTAACCCACTCGTGCACCC -3′) probe (/5HEX/TGGGTGAGC/ZEN/AAAAACAGGAAGGC/3IABkFQ/). The reported final copy number of mEGFP per genome is calculated as the ratio of [(copies/µLmEGFP)-(copies/µLnonintegraedAMP)]/(copies/µLRPP30), where a ratio of 0.5 ~ 1 copy per genome and a ratio of 1 ~ 2 copies/genome. The AMP sequence is only used to normalize mEGFP signal when integration into the genome is ruled out during primary screening. For primary screening [(copies/µLmEGFP)/(copies/µLRPP30) is plotted against [(copies/µLAMP)/(copies/µLRPP30) in order to identify cohorts of clones for ongoing analysis. Learn how we perform ddPCR on our Standard Operating Procedures page.
During clone expansion, a sample of cells is pelleted for total gDNA extraction using the PureLink Pro 96 Genomic DNA Purification Kit (Life Technologies). ddPCR is performed using the Bio-Rad QX200 Droplet Reader, Droplet Generator, and QuantaSoft software. The reference assay for the 2-copy, autosomal gene RPP30 is purchased from Bio-Rad. The assay for mEGFP detection is as follows: primers (5′-GCCGACAAGCAGAAGAACG-3′, 5′-GGGTGTTCTGCTGGTAGTGG-3′) probe (/56-FAM/AGATCCGCC/ZEN/ACAACATCGAGG/3IABkFQ/). The assay for AMP is as follows: primers (5′- TTTCCGTGTCGCCCTTATTCC -3′, 5′- ATGTAACCCACTCGTGCACCC -3′) probe (/5HEX/TGGGTGAGC/ZEN/AAAAACAGGAAGGC/3IABkFQ/). The reported final copy number of mEGFP per genome is calculated as the ratio of [(copies/µLmEGFP)-(copies/µLnonintegraedAMP)]/(copies/µLRPP30), where a ratio of 0.5 ~ 1 copy per genome and a ratio of 1 ~ 2 copies/genome. The AMP sequence is only used to normalize mEGFP signal when integration into the genome is ruled out during primary screening. For primary screening [(copies/µLmEGFP)/(copies/µLRPP30) is plotted against [(copies/µLAMP)/(copies/µLRPP30) in order to identify cohorts of clones for ongoing analysis. Learn how we perform ddPCR on our Standard Operating Procedures page.
Genetic screening with tiled junctional PCR
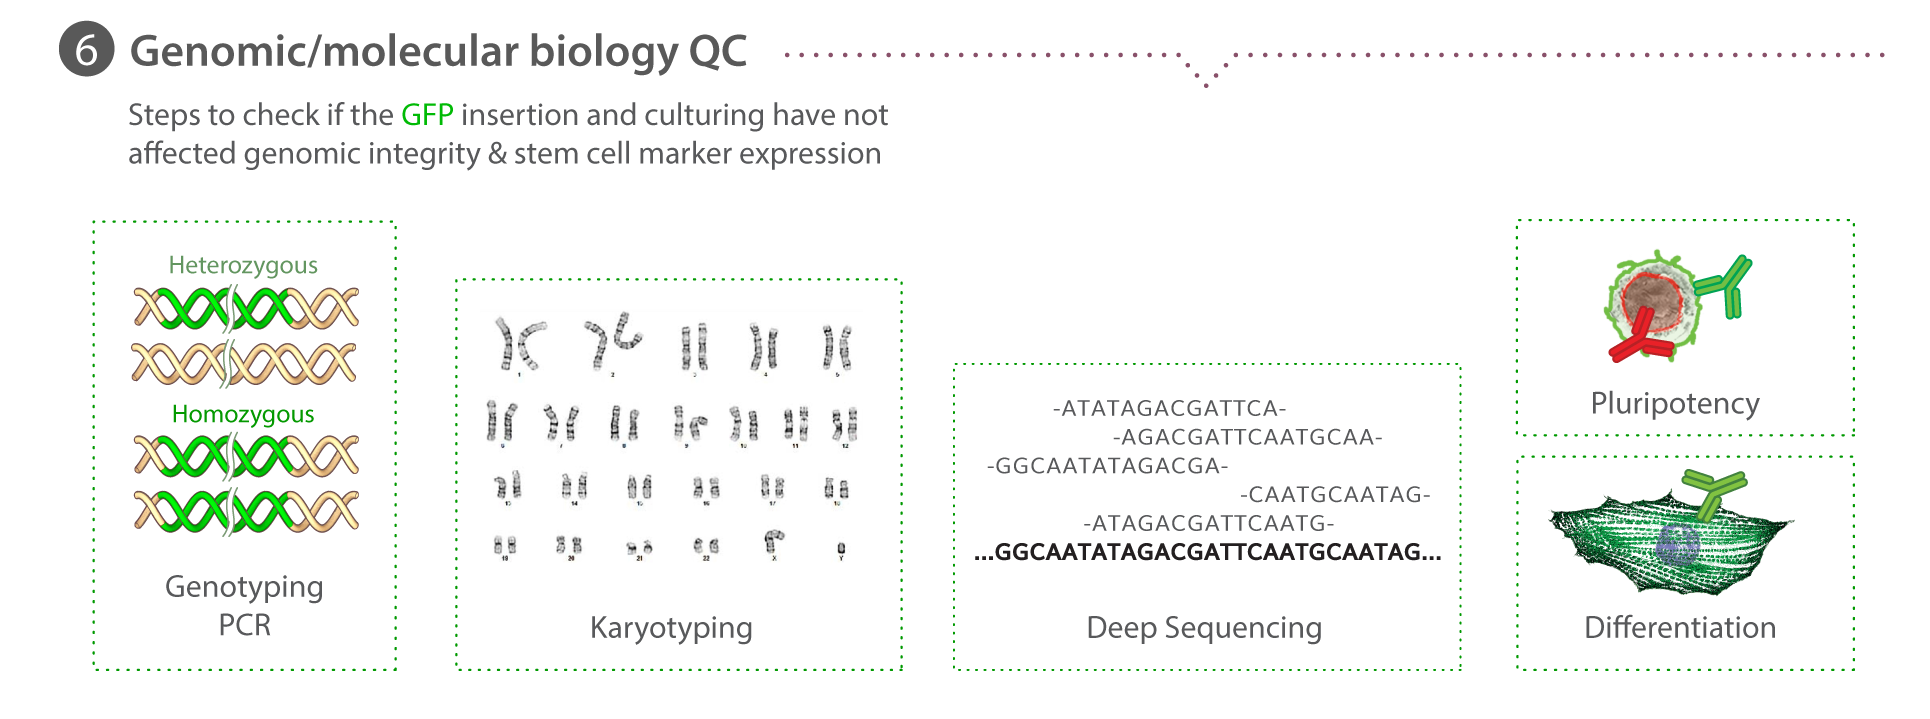
PCR was used to amplify the tagged allele in two tiled reactions spanning the left and right homology arms, the mEGFP and linker sequence, and portions of the distal genomic region 5’ of the left homology arm and 3’ of the right homology arm using PrimeStar® (Clontech) PCR reagents and gene-specific primers. Both tiled junctional PCR products were Sanger sequenced bi-directionally with PCR primers when their size was validated by gel electrophoresis and/or fragment analysis (Advanced Analytics Fragment Analyzer).
Screening for clones with wild type untagged allele sequences
PCR is also used to amplify the untagged allele using gene-specific primers. These primers do not selectively amplify the unmodified locus, as is the case for tiled junctional PCR amplification of the tagged allele, but rather amplified both untagged and tagged alleles. Tracking of insertions and deletions (INDELs) by decomposition (TIDE) analysis is performed manually on the amplification reaction after bidirectional Sanger sequencing in order to determine the sequence of the untagged allele. For all final clones with wild type untagged alleles, the PCR product corresponding to the untagged allele is gel isolated and sequenced to confirm the initial result from TIDE analysis.
Off-target PCR screening
Cas-OFFinder is used to identify potential off-targets (NRG PAMs with up to 3 mismatches and 1 DNA or RNA bulge) in GRCh38 genome build. Cas-OFFinder output is further filtered to identify the most problematic off-targets with the fewest number of flaws (flaw = mismatch or bulge). Problematic off-targets are defined as off-targets with up to one flaw in the seed region (10 nts at 3’ end) and up to 2 flaws in the non-seed region (10 nts at 5’ end) with an NGG or NAG PAM. 8-10 of these off-targets are selected for sequencing with the goal of checking ~4 off-targets that fell close to exons (within 50bp) or within exons (exon feature in GRCh38 NCBI annotation 107) and ~4 off-targets that are closest in sequence to on-target crRNA. Approximately 300bp of sequence flanking each off-target is amplified by PCR and Sanger sequenced.
Pluripotency testing by flow cytometry
Cells are dissociated with Accutase as described above, fixed with CytoFix Fixation Buffer™ for 30 minutes at 4°C, and frozen in KnockOut™ Serum Replacement (Gibco) with 10% DMSO. Cells are washed with 2% BSA in DPBS and half of the cells are stained with anti-TRA-1-60 Brilliant Violet™ 510, anti-SSEA-3 AlexaFluor® 647, and anti-SSEA-1 Brilliant Violet™ 421. The other half of the cells are permeabilized with 0.1% Triton-X100 and 2% BSA in DPBS and stained with anti-Nanog AlexaFluor® 647, anti-Sox2 V450, and anti-Oct-3/4 Brilliant Violet™ 510. Cells are acquired on a FACSAriaIII Fusion equipped with 405, 488, 561, and 637 nm lasers and analyzed using FlowJo V.10.2. Doublets are excluded using forward scatter and side scatter, then marker-specific gates are set according to corresponding fluorescence-minus-one (FMO) controls to obtain the percent positive for each marker. Forward scatter and side scatter is used to distinguish cells and debris for analysis.
Karyotype analysis
Karyotype analysis is performed by Diagnostic Cytogenetics Inc. At a minimum 20 metaphase cells are analyzed per clone.
RNA-Seq analysis
Two independent clonal populations are sequenced from each cell line. After dissociation of cell cultures with Accutase, 2-3 x 10⁶ cells are pelleted, washed once with DPBS and either re-suspended in 350 µL of Qiagen RLT plus lysis buffer or left as cell pellets, then flash frozen in liquid nitrogen before storage at -80˚C. The variation in cell pellet treatment is based on the sequencing service provider’s sample submission guidelines. 101bp paired end libraries are prepared using an Illumina TruSeq Total RNA kit. Libraries are sequenced on an Illumina HiSeq 2500 at a depth of 30-50 million read pairs. Reads are mapped to human genome build GRCh38 and NCBI annotations 107 using STAR aligner. Read counts are extracted from each alignment using htseq, and differentially expressed genes relative to the reference WTC line are identified using DESeq2. Size factors and dispersions are estimated from all samples and differentially expressed genes are identified using pairwise Wald tests in DESeq2 (Benjamini-Hochberg adjusted p-value < 0.05 w/ abs (log2 fold change) > 1).
Two independent clonal populations are sequenced from each cell line. After dissociation of cell cultures with Accutase, 2-3 x 10⁶ cells are pelleted, washed once with DPBS and either re-suspended in 350 µL of Qiagen RLT plus lysis buffer or left as cell pellets, then flash frozen in liquid nitrogen before storage at -80˚C. The variation in cell pellet treatment is based on the sequencing service provider’s sample submission guidelines. 101bp paired end libraries are prepared using an Illumina TruSeq Total RNA kit. Libraries are sequenced on an Illumina HiSeq 2500 at a depth of 30-50 million read pairs. Reads are mapped to human genome build GRCh38 and NCBI annotations 107 using STAR aligner. Read counts are extracted from each alignment using htseq, and differentially expressed genes relative to the reference WTC line are identified using DESeq2. Size factors and dispersions are estimated from all samples and differentially expressed genes are identified using pairwise Wald tests in DESeq2 (Benjamini-Hochberg adjusted p-value < 0.05 w/ abs (log2 fold change) > 1).
Immunocytochemistry & fixed cell imaging
All cell lines except for TUBA1B were fixed and permeabilized in 24- or 96-well plates with a solution of 4% paraformaldehyde (15710 , Electron Microscopy Sciences Hatfield, PA) and 0.5% Triton X-100 (TX1568-3 ,EMD Millipore) for 10-15 min. TUBA1B cells were fixed in -20°C methanol for 5 min. Following fixation and permeabilization, all cells were blocked with 1% or 5% BSA (15260-037, ThermoFisher Scientific) in 1x PermWash Buffer (51-2091K7, BD Biosciences), incubated in primary antibody overnight at 4°C, followed by incubation in AlexaFluor®-conjugated secondary antibodies (see Table 1 below) and DAPI (1x NucBlue Fixed Cell Stain, R37606, ThermoFisher Scientific) for 2 hr at room temperature. In the case of ACTB, cells were stained with Rhodamine Phalloidin (R415, ThermoFisher Scientific) at 1:1000. SlowFade Gold (S36936, ThermoFisher Scientific) mounting media was added to the cells after a final washing step and cells were stored at -20°C until imaged as described in the above section. All fixed cells except for DSP and SEC61B were imaged on a 3i system with a Zeiss 100x/1.46 NA α-plan APOCHROMAT oil objective, CSU-W1 Yokogawa spinning disk head and Hammamatsu Orca Flash 4.0 camera. DSP cells (and corresponding controls) were imaged on a Zeiss laser scanning (LSM) 880 confocal microscope with a Zeiss C-APOCHROMAT 40x/1.2 W Korr FCS M27 objective. SEC61-ß cells were imaged with a Zeiss 100x/1.25 W C APOCHROMAT Korr UV Vis IR objective, a CSU-W1 Yokogawa spinning disk head, and Hammamatsu Orca Flash 4.0 camera.
All cell lines except for TUBA1B were fixed and permeabilized in 24- or 96-well plates with a solution of 4% paraformaldehyde (15710 , Electron Microscopy Sciences Hatfield, PA) and 0.5% Triton X-100 (TX1568-3 ,EMD Millipore) for 10-15 min. TUBA1B cells were fixed in -20°C methanol for 5 min. Following fixation and permeabilization, all cells were blocked with 1% or 5% BSA (15260-037, ThermoFisher Scientific) in 1x PermWash Buffer (51-2091K7, BD Biosciences), incubated in primary antibody overnight at 4°C, followed by incubation in AlexaFluor®-conjugated secondary antibodies (see Table 1 below) and DAPI (1x NucBlue Fixed Cell Stain, R37606, ThermoFisher Scientific) for 2 hr at room temperature. In the case of ACTB, cells were stained with Rhodamine Phalloidin (R415, ThermoFisher Scientific) at 1:1000. SlowFade Gold (S36936, ThermoFisher Scientific) mounting media was added to the cells after a final washing step and cells were stored at -20°C until imaged as described in the above section. All fixed cells except for DSP and SEC61B were imaged on a 3i system with a Zeiss 100x/1.46 NA α-plan APOCHROMAT oil objective, CSU-W1 Yokogawa spinning disk head and Hammamatsu Orca Flash 4.0 camera. DSP cells (and corresponding controls) were imaged on a Zeiss laser scanning (LSM) 880 confocal microscope with a Zeiss C-APOCHROMAT 40x/1.2 W Korr FCS M27 objective. SEC61-ß cells were imaged with a Zeiss 100x/1.25 W C APOCHROMAT Korr UV Vis IR objective, a CSU-W1 Yokogawa spinning disk head, and Hammamatsu Orca Flash 4.0 camera.
Table 1: Primary antibodies
Antibody |
Type |
Source |
Application |
Secondary antibody used |
α-tubulin |
mouse monoclonal, clone DM1A |
ThermoFisher #62204 |
WB: 1:10,000 IF: 1:250 |
goat anti-mouse goat anti-mouse |
ß-actin |
mouse monoclonal, clone GT5512 |
GeneTex #GTX629630 |
WB: 1:10,000 |
goat anti-mouse |
desmoplakin |
rabbit polyclonal NW6 rabbit polyclonal 1G4 |
Kathleen Green, Northwestern University |
WB, 1:1,000 IF: 1:20 |
goat anti-rabbit goat anti-rabbit |
fibrillarin |
rabbit polyclonal |
Abcam #ab5821 |
WB: 1:800 IF: 1:100 |
goat anti-rabbit goat anti-rabbit |
lamin B1 |
rabbit polyclonal |
Abcam #ab16048 |
WB: 1:2,000 IF: 1:500 |
goat anti-rabbit goat anti-rabbit |
myosin IIB |
rabbit polyclonal |
Cell Signaling Technology #3404 |
WB, 1:1,000 IF: 1:200 |
goat anti-rabbit goat anti-rabbit |
paxillin |
mouse monocolonal, clone 349 |
BD Biosciences #610051 |
WB: 1:10,000 IF: 1:750 |
goat anti-mouse goat anti-mouse |
Sec61-ß |
rabbit polyclonal rabbit polyclonal |
•Abcam #ab15576 •Sigma Aldrich #HPA049407 |
WB: 1:10,000 IF 1:250 IF: 1:25 |
goat anti-rabbit goat anti-rabbit |
ZO1 |
rabbit polyclonal |
ThermoFisher #617300 |
WB: 1:500 IF: 1:50 |
goat anti-rabbit |
Tom20 |
mouse monoclonal clone F10 |
Santa Cruz Biotechnologies #sc17764 |
WB: 1:250 IF: 1:100 |
goat anti-mouse goat anti-mouse |
ß-actin (loading control) |
mouse monoclonal, clone BA3R |
ThermoFisher #MA515739 |
WB: 1:10,000 |
goat anti-mouse |
α-actinin (loading control) |
mouse monoclonal, clone 0.T.02 |
ThermoFisher #MA191860 |
WB: 1:2,000 |
goat anti-mouse |
GFP |
mouse monoclonal mix, clones 7.1 and 13.1 |
Sigma Aldrich #11814460001 |
WB: 1:250 |
goat anti-mouse |
Table 2. Secondary antibodies
Antibody |
Type |
Source |
Application |
goat anti-mouse IgG (H+L), Alexa Fluor® 647 conjugate |
goat polyclonal |
ThermoFisher #A21236 |
WB: 1:10,000 IF: 1:500 |
goat anti-rabbit IgG (H+L), Alexa Fluor® 647 conjugate |
goat polyclonal |
ThermoFisher #A21245 |
WB: 1:10,000 IF: 1:500 |
Western blotting
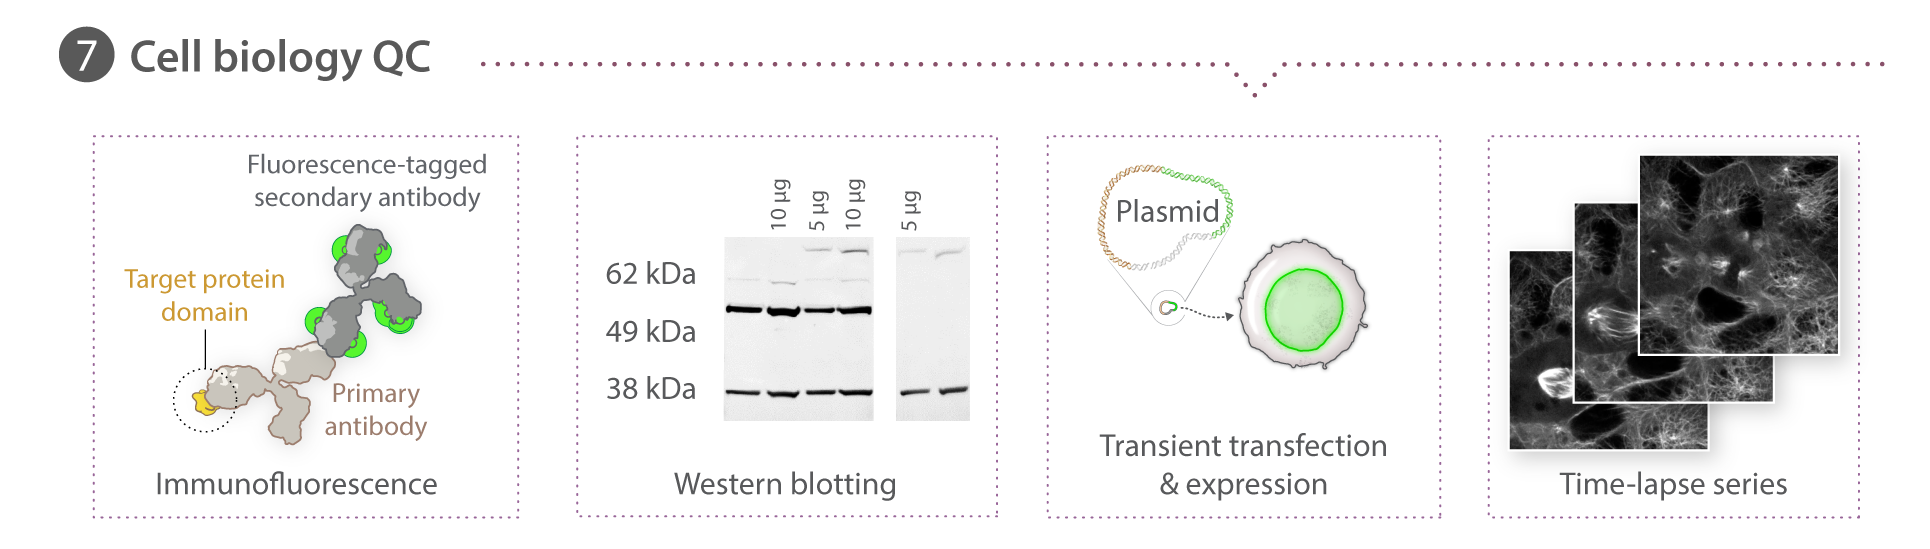
Whole-cell lysate was extracted from cell lines using M-PER buffer (78501, ThermoFisher Scientific) supplemented with 1X Halt protease and phosphatase inhibitors (78442, ThermoFisher), 0.16 M MgCl2 and 100 U Pierce universal nuclease (88700, ThermoFisher Scientific) on ice for 30 min or urea sample buffer (USB: 8M urea, 1% SDS, 10% glycerol, 0.06 M Tris pH 6.8, 0.001% pyronin Y). M-PER-based cell lysates were boiled for 5 minutes, then diluted with 1:1 Bolt LDS sample buffer (B008, ThermoFisher Scientific), heated at 70°C for 10 min and stored at -20°C. Prior to gel electrophoresis, M-PER-based samples were diluted to a final concentration with 1X Bolt LDS sample buffer, supplemented with 1X Bolt sample reducing agent (B0009, Thermo Fisher Scientific) and heated to 70°C for 10 min. USB-based cell lysates were triturated with a syringe and a 27g needle and stored at -20°C. For electrophoresis, USB-based samples were supplemented with 5% ß-mercaptoethanol (190242, ThermoFisher Scientific). Lysates were separated on 4-12% Bolt Bis-Tris Plus gels (NM04122BOX, ,ThermoFisher Scientific), 1X MOPS SDS running buffer (B0001, ThermoFisher Scientific) supplemented with Bolt antioxidant (BT005, ThermoFisher Scientific) or NuPAGE Novex 3-8% Tris-Acetate gels (EA0378BOX, ThermoFisher Scientific), 1x Tris acetate SDS running buffer (LA004, ThermoFisher Scientific), supplemented with Bolt antioxidant and transferred onto 0.45 µm nitrocellulose membranes (LC2001, ThermoFisher Scientific) using the XCell SureLock Mini-Cell System (ThermoFisher Scientific). Untagged and GFP-tagged proteins were detected using protein-specific and GFP-specific antibodies in PBS-T with 5% milk overnight at 4°C (see Table 1 for details). ß-actin was used as the loading control for PXN, SEC61B, TUBA1B, TJP1, and MYH10, while α-tubulin was used for LMNB1, FBL, ACTB and DSP, and α-actinin for TOMM20 (see Table 1 for details). Goat polyclonal anti-mouse AlexaFluorR 647-conjugated secondary antibody or goat polyclonal anti-rabbit AlexaFluorR 647-conjugated antibody) were used as secondary antibodies as described in Table 2 above. Blots were imaged at different exposure times using the ChemiDoc MP system (Bio-Rad Laboratories) and appropriate exposure times were used for semi-quantitative analysis of protein levels.
Whole-cell lysate was extracted from cell lines using M-PER buffer (78501, ThermoFisher Scientific) supplemented with 1X Halt protease and phosphatase inhibitors (78442, ThermoFisher), 0.16 M MgCl2 and 100 U Pierce universal nuclease (88700, ThermoFisher Scientific) on ice for 30 min or urea sample buffer (USB: 8M urea, 1% SDS, 10% glycerol, 0.06 M Tris pH 6.8, 0.001% pyronin Y). M-PER-based cell lysates were boiled for 5 minutes, then diluted with 1:1 Bolt LDS sample buffer (B008, ThermoFisher Scientific), heated at 70°C for 10 min and stored at -20°C. Prior to gel electrophoresis, M-PER-based samples were diluted to a final concentration with 1X Bolt LDS sample buffer, supplemented with 1X Bolt sample reducing agent (B0009, Thermo Fisher Scientific) and heated to 70°C for 10 min. USB-based cell lysates were triturated with a syringe and a 27g needle and stored at -20°C. For electrophoresis, USB-based samples were supplemented with 5% ß-mercaptoethanol (190242, ThermoFisher Scientific). Lysates were separated on 4-12% Bolt Bis-Tris Plus gels (NM04122BOX, ,ThermoFisher Scientific), 1X MOPS SDS running buffer (B0001, ThermoFisher Scientific) supplemented with Bolt antioxidant (BT005, ThermoFisher Scientific) or NuPAGE Novex 3-8% Tris-Acetate gels (EA0378BOX, ThermoFisher Scientific), 1x Tris acetate SDS running buffer (LA004, ThermoFisher Scientific), supplemented with Bolt antioxidant and transferred onto 0.45 µm nitrocellulose membranes (LC2001, ThermoFisher Scientific) using the XCell SureLock Mini-Cell System (ThermoFisher Scientific). Untagged and GFP-tagged proteins were detected using protein-specific and GFP-specific antibodies in PBS-T with 5% milk overnight at 4°C (see Table 1 for details). ß-actin was used as the loading control for PXN, SEC61B, TUBA1B, TJP1, and MYH10, while α-tubulin was used for LMNB1, FBL, ACTB and DSP, and α-actinin for TOMM20 (see Table 1 for details). Goat polyclonal anti-mouse AlexaFluorR 647-conjugated secondary antibody or goat polyclonal anti-rabbit AlexaFluorR 647-conjugated antibody) were used as secondary antibodies as described in Table 2 above. Blots were imaged at different exposure times using the ChemiDoc MP system (Bio-Rad Laboratories) and appropriate exposure times were used for semi-quantitative analysis of protein levels.
Transient transfection for live cell imaging
The constructs pmEGFP-a-tubulin-C1 (gift from Daniel Gerlich, addgene plasmid # 21039), 1136-Desmoplakin-GFP (gift from Kathleen Green, addgene plasmid # 32227) and mCherry-TOMM20-N-10 (gift from Michael Davidson, addgene plasmid #55146) were used for transient transfections. Bacterial strains containing the constructs were grown in 200 mL Terrific Broth (A1374301, ThermoFisher Scientific) supplemented with 100 µg/mL carbenicillin (BP26481, ThermoFisher Scientific) or 100 µg/mL kanamycin (BP9065, ThermoFisher Scientific) overnight in a shaking incubator at 37°C. DNA plasmids were extracted from the bacterial cultures using an EndoFree Plasmid Maxi Kit (12362, QIAGEN) according to manufacturer’s instructions and resuspended in the provided endotoxin-free water. DNA concentrations were quantified using a NanoDrop8000 (ThermoFisher Scientific) and stored at -20°C. A working DNA stock for transfections was made by diluting the DNA to a final concentration of 0.25 µg/µL in Opti-MEM (31985070, ThermoFisher Scientific) and stored at -20°C. Three days after cells were plated, they were transfected using the GeneJuice® Transfection Reagent (70967, EMD Millipore). Media was replaced with phenol red-free mTeSR1 30-60 minutes prior to transfection. 1.5 μL GeneJuice transfection reagent was diluted in 25 μLOpti-MEM and incubated at room temperature for 5 min. 1 μg DNAwas added to the GeneJuice-Opti-MEM solution and incubated for 10 min. 6 μL of this final transfection solution was added per 100 μL media in the well of a 96 well-plate. Live cells were imaged as specified above one day after transfection.
The constructs pmEGFP-a-tubulin-C1 (gift from Daniel Gerlich, addgene plasmid # 21039), 1136-Desmoplakin-GFP (gift from Kathleen Green, addgene plasmid # 32227) and mCherry-TOMM20-N-10 (gift from Michael Davidson, addgene plasmid #55146) were used for transient transfections. Bacterial strains containing the constructs were grown in 200 mL Terrific Broth (A1374301, ThermoFisher Scientific) supplemented with 100 µg/mL carbenicillin (BP26481, ThermoFisher Scientific) or 100 µg/mL kanamycin (BP9065, ThermoFisher Scientific) overnight in a shaking incubator at 37°C. DNA plasmids were extracted from the bacterial cultures using an EndoFree Plasmid Maxi Kit (12362, QIAGEN) according to manufacturer’s instructions and resuspended in the provided endotoxin-free water. DNA concentrations were quantified using a NanoDrop8000 (ThermoFisher Scientific) and stored at -20°C. A working DNA stock for transfections was made by diluting the DNA to a final concentration of 0.25 µg/µL in Opti-MEM (31985070, ThermoFisher Scientific) and stored at -20°C. Three days after cells were plated, they were transfected using the GeneJuice® Transfection Reagent (70967, EMD Millipore). Media was replaced with phenol red-free mTeSR1 30-60 minutes prior to transfection. 1.5 μL GeneJuice transfection reagent was diluted in 25 μLOpti-MEM and incubated at room temperature for 5 min. 1 μg DNAwas added to the GeneJuice-Opti-MEM solution and incubated for 10 min. 6 μL of this final transfection solution was added per 100 μL media in the well of a 96 well-plate. Live cells were imaged as specified above one day after transfection.
Labeling cells with fluorescent dyes
Three to four days after cells are plated and mature and healthy colonies are observed on 96- and 24-well imaging plates, the cells are stained with NucBlue Live ready probe reagent (R37605, ThermoFisher) and CellMask Deep Red plasma membrane stain (C10046, ThermoFisher) to visualize DNA and plasma membrane, respectively. Phenol red free mTeSR1 is pre-equilibrated to 37°C and 5% CO2. 1X NucBlue solution made in pre-equilibrated phenol red-free mTeSR1 is spun for 60 min at 20,000 g. 2X and 10X working stocks of CellMask Deep Red lot #1730970 and #1813792 are made in 1X NucBlue solution, respectively. All solutions are kept at 37°C and 5% CO2 until used. 100 µL and 400 µL of NucBlue solution is added per well of 96-well imaging plates and 24-well imaging plates, respectively, and incubated at 37°C and 5% CO2 for 20 min. An equal amount of CellMask Deep Red working stock is added to the wells containing NucBlue solution. Final dye concentrations in the wells are 1X NucBlue and 1X and 5X CellMask Deep Red lots #1730970 and #1813792, respectively. Cells are incubated at 37°C and 5% CO2 for 10 min and gently washed with pre-equilibrated phenol red-free mTeSR1. Cells are imaged immediately following the wash step and for up to 2.5 hr on a Zeiss spinning disk microscope at 100x with the following general settings: 405 nm at 0.28 mW, 200 ms exposure; 638 nm at 2.4 mW, 200 ms exposure; acquiring each channel at each z-step.
Three to four days after cells are plated and mature and healthy colonies are observed on 96- and 24-well imaging plates, the cells are stained with NucBlue Live ready probe reagent (R37605, ThermoFisher) and CellMask Deep Red plasma membrane stain (C10046, ThermoFisher) to visualize DNA and plasma membrane, respectively. Phenol red free mTeSR1 is pre-equilibrated to 37°C and 5% CO2. 1X NucBlue solution made in pre-equilibrated phenol red-free mTeSR1 is spun for 60 min at 20,000 g. 2X and 10X working stocks of CellMask Deep Red lot #1730970 and #1813792 are made in 1X NucBlue solution, respectively. All solutions are kept at 37°C and 5% CO2 until used. 100 µL and 400 µL of NucBlue solution is added per well of 96-well imaging plates and 24-well imaging plates, respectively, and incubated at 37°C and 5% CO2 for 20 min. An equal amount of CellMask Deep Red working stock is added to the wells containing NucBlue solution. Final dye concentrations in the wells are 1X NucBlue and 1X and 5X CellMask Deep Red lots #1730970 and #1813792, respectively. Cells are incubated at 37°C and 5% CO2 for 10 min and gently washed with pre-equilibrated phenol red-free mTeSR1. Cells are imaged immediately following the wash step and for up to 2.5 hr on a Zeiss spinning disk microscope at 100x with the following general settings: 405 nm at 0.28 mW, 200 ms exposure; 638 nm at 2.4 mW, 200 ms exposure; acquiring each channel at each z-step.

In vitro directed differentiation of hiPSCs to cardiomyocytes
Cells are seeded onto GFR Matrigel-coated 6-well tissue culture plates at a density ranging from 0.15-0.25x10⁶ cells per well in mTeSR1 supplemented with 1% P/S and 10 µM ROCK inhibitor, designated as day -3. Cells are grown for three days, with daily mTeSR1 media changes (day -2 and day -1). The following day (designated as day 0), directed cardiac differentiation is initiated by treating the cultures with 7.5 µM CHIR99021 (Cayman Chemical) in RPMI media (Gibco) containing insulin-free B27 supplement (Gibco). After 48 hours (day 2), cultures are treated with 7.5 µM IWP2 (R&D systems) in RPMI media containing insulin-free B27 supplement. On day 4, cultures are treated with RPMI media containing insulin-free B27 supplement. From day 6 onwards, media is replaced with RPMI media supplemented containing B27 containing insulin (Gibco) every 2-3 days.
Cells are harvested using TrypLE Select (10x, Gibco) diluted to 2x with Versene (Gibco), fixed with 4% PFA in DPBS for 10 minutes at room temperature, permeabilized with BD Perm/Wash™ buffer containing anti-Cardiac Troponin T AlexaFluor® 647 or equal mass of mIgG1, k AF647 isotype control (all BD Bioscience), washed, then re-suspended in 5% FBS in DPBS with DAPI (2µg/ml), acquired on a FACSAriaIII (BD Bioscience) Fusion and analyzed using FlowJo software V.10.2. (Treestar, Inc.) Nucleated particles are identified as a sharp, condensed peak on a DAPI histogram and are then gated to exclude doublets as described above. The cTnT+ gate is set to include 1% of cells in the isotype control sample.
Microscopy
A. Overview |
Vertical Divider
We require large numbers of 3D images of live cells to understand and predict the states and variance of the human cell. We built an automated pipeline based on spinning disk light microscopy. We optimized every step to create high-quality, standardized data sets in high replicates.
|
1. Sample Preparation
|
2. Imaging
|
3. Image Processing
|
4. Data Management
|
BACKGROUND
Human induced pluripotent stem cells (hiPSC) grow as densely packed epithelial-like monolayers on Matrigel coated glass. They are up to 20μm tall.
hiPS Cell Biology Overview >>
We chose spinning disk microscopy and robotics for sample preparation as the central part of the pipeline because it is optimized for:
To add more information to our data, we plan to build additional pipelines based on the Zeiss LSM 880 Airy fast, FCS, and image correlation techniques.
We visualize all structures with diffraction limited optical microscopy and collect four channels:
hiPS Cell Biology Overview >>
We chose spinning disk microscopy and robotics for sample preparation as the central part of the pipeline because it is optimized for:
- Live cell imaging
- 3D microscopy
- Image quality
- Reproducibility
To add more information to our data, we plan to build additional pipelines based on the Zeiss LSM 880 Airy fast, FCS, and image correlation techniques.
We visualize all structures with diffraction limited optical microscopy and collect four channels:
- Structure of interest (eGFP)
- Nucleus as reference (NucBlue)
- Plasma membrane to define shape of cell (CellMask)
- Transmitted light
B. Grow Large Quantities of Cells |
Vertical Divider
For statistical modelling and analysis of variance and to discover rare states, we produce large numbers of images for each cell line. As a first step we manually grow and passage the cell population before seeding it on glass.
|
C. Prepare for Imaging in 96-well Plates |
Vertical Divider
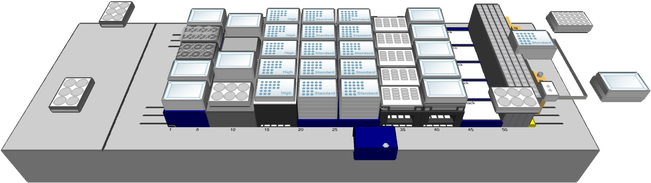
To streamline automation, maximize throughput, standardization and reproducibility, we use robotics to seed cells in 96-well plates with optical glass bottoms for high-resolution optical fluorescence microscopy.
|
Instrumentation
ROBOTICS
Cells are seeded and maintained on a Hamilton Microlab Star (Hamilton Company, Reno, NV, USA) robotic pipetting workstation equipped with:
- Arm with 8 channels for pipetting
- iSWAP plate handler
- Orbit barcode scanner
- 2 MultiFlex tilt modules
- CPAC heating/cooling unit
- Tip and tube carrier and plate stacking modules
- Star HEPA filter with UV light option
- Cytomat 24C (Thermo Fisher) incubator (37℃, 85% humidity and 5% CO2)
- Cytomat 6002 refrigerator (Thermo Fisher)
(4℃) - Venus 2 ver. 4. software
- Venus 1 Dynamic Scheduler 5.1
96-WELL PLATES
For all imaging experiments we use 96-well glass-bottom plates (Cellvis, Mountain View, CA, # P96-1.5H-N):
- Black polystyrene frame
- High performance #1.5 cover glass (0.170±0.005mm)
- Lid
- Individually packed and sterilized
CONTROLS
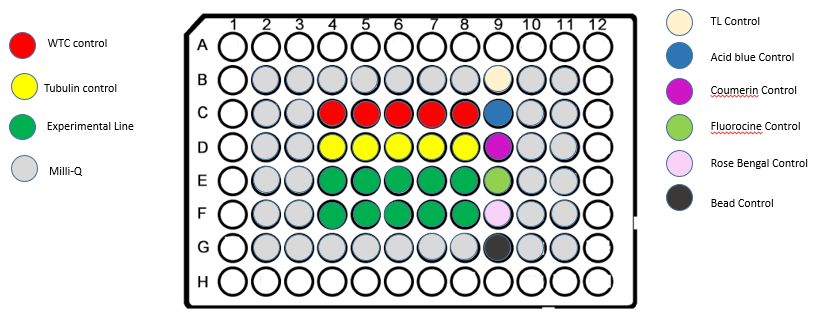
Each plate has the following controls:
- Dye solutions for illumination profile correction:
- Coumarin 102 (Sigma-Aldrich, #546151)
- Fluorescein (Sigma-Aldrich, #32615)
- Acid Blue 9 (TCI, # CI-42090)
- Rose Bengal (Sigma-Aldrich, #198250)
- Mixed TetraSpeck beads (0.1μm diameter, Thermo Fischer, # T7284) and FocalCheck beads (15μm diameter, Thermo Fischer, # F7239) for resolution and alignment check
- Unlabeled hiPSC (Link to AICS-0)
- hiPSC with eGFP fused to tubulin (Link to AICS-12)
Overview
WORKFLOW
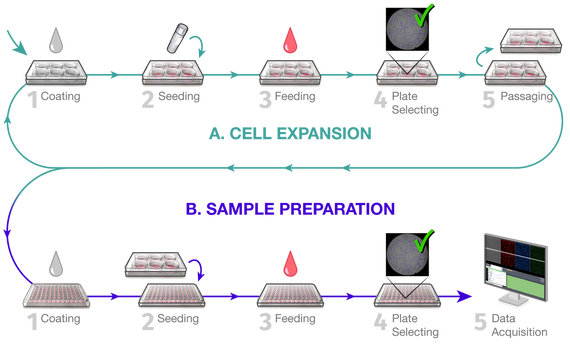
1. Robotic Matrigel Coating
|
2. Robotic Cell Seeding
|
3. Cell Maintenance (once per day)
|
4. Plate LayoutFor standard pipeline experiments, we use a plate layout with 10 wells for experimental lines. We add wells with 6 controls.
|
D. Quality Control at Well Level |
Vertical Divider
The pluri-potent hiPS cells have a natural tendency to differentiate. To ensure a well-defined cell state for pipeline experiments and to avoid cell health issues, we implemented a rigorous quality control regime. One important step is to assess colony health for whole wells before imaging. For this assessment, we use images acquired with a plate scanner and analyze them using CellProfiler.
|
Instrumentation
ROBOTICS
Cells are seeded and maintained on a Hamilton Microlab Star (Hamilton Company, Reno, NV, USA) robotic pipetting workstation equipped with:
- Arm with 8 channels for pipetting
- iSWAP plate handler
- Orbit barcode scanner
- 2 MultiFlex tilt modules
- CPAC heating/cooling unit
- Tip and tube carrier and plate stacking modules
- Star HEPA filter with UV light option
- Cytomat 24C (Thermo Fisher) incubator (37℃, 85% humidity and 5% CO2)
- Cytomat 6002 refrigerator (Thermo Fisher)
(4℃) - Venus 2 ver. 4. software
- Venus 1 Dynamic Scheduler 5.1
Overview
WORKFLOW
- Remove plate from incubator
- Place plate into plate scanner
- Acquire transmitted light images of all wells
- Move plate back into incubator
- Transfer images to cluster
- Process images with CellProfiler
- Segment colonies
- Remove small colonies
- Count colonies
- Rank wells and plates by count
WELLL QUALITY
To make sure that all cell images in a data set come from a visibly homogeneous population, we exclude wells that show:
Link: SOP: WTC culture v1.1
Link: SOP: Cell plating for imaging v1.0
- Balling colonies (>3 balling events/well)
- Differentiation (>2 identifiable events/well)
- High number of dead cells (>50% of cells/well)
Link: SOP: WTC culture v1.1
Link: SOP: Cell plating for imaging v1.0
E. Focus on Reproducible Cell States |
Vertical Divider
hiPSC grow in colonies. We manually select colonies and positions within colonies to ensure all images coming from cells residing in similar environments.
|
Instrumentation
PIPELINE MICROSCOPES
For pipeline operation we use three spinning disk microscopes (Carl Zeiss Cell Observer SD):
- Yokogawa CSU-X1 spinning disk head (micro-lens enhanced Nipkow disk, about 20,000 pinholes (1,000 in imaging area), beam shaping optics to improve illumination profile)
- 2x sCMOS cameras (Hamamatsu ORCA-Flash 4.0 V2+, 6.5µm x 6.5µm pixel size)
- 1.2 magnification in front of cameras
- Zeiss Plan-Apochromat 10x/0.45 air objective
- Zeiss C-Apochromat 100x/1.25 water immersion objective
- Laser lines (nominal laser power at laser):
- 405nm (50mW)
- 488nm (50mW)
- 561nm (50mW)
- 638nm (75mW)
- AxioObserver 7 motorized inverted microscope
- Definite Focus 2
- Pecon environmental chamber and controls (temperature, humidity control, CO2 control)
- Okolab stage incubator for 96-well plates (temperature, humidity, CO2)
- Motorized xy-stage
- Prior Piezo z-stage (100µm z-travel)
- Zeiss ZEN blue software
- Newport air table for vibration isolation
ADDITIONAL MICROSCOPY
We use additional widefield and confocal microscopes for R&D and assay development work. Some of them will be used in future imaging pipelines.
- 3i Yokogawa CSU-W1 spinning disk system
- Additional Carl Zeiss CSU-X1 spinning disk system for assay development
- Carl Zeiss LSM 800 with Airy Detector
Overview
WORKFLOW
- Equilibrate environmental chamber and stage incubator at 37°C, saturated humidity, 5% CO2
- Set-up system for transmitted light imaging
- Select wells based on colony quality and distribution
- Acquire overview images of wells with 10x/0.45 air objective using tile scan
- Manually select well-defined positions within colonies (edge, ridge, or center) and record within Zen software for automated imaging
- Select area without cells for background correction
- Remove 96-well plate and stain nucleus and cell membrane
COLONY QUALITY
We select areas within colonies for imaging based on colony and cell morphology:
Link: SOP WTC culture v1.1
Link: SOP Cell plating for imaging v1.0
- More than 300 cells per colony
- Well packed
- No lifting or signs of differentiation
Link: SOP WTC culture v1.1
Link: SOP Cell plating for imaging v1.0
F. Nucleus & Cell Membrane as References |
Vertical Divider
We want to understand the locations of various subcellular structures. To do this, we use dyes that illuminate the nucleus and cell membrane as positional references markers.
|
Overview
LABELING OF REFERENCE STRUCTURES
We visualize reference structures with organic dyes:
Complete, phenol red-free mTeSR1 culture media: 400 ml basal media with 100ml 5x supplement (Stem Cell Technologies custom order) with added 1% penicillin streptomycin (Gibco #15070-063)
- DNA: NucBlue Live ready probe reagent (Thermo Fisher, # R37605)
- Plasma Membrane: CellMask Deep Red plasma membrane stain (Thermo Fisher, # C10046)
Complete, phenol red-free mTeSR1 culture media: 400 ml basal media with 100ml 5x supplement (Stem Cell Technologies custom order) with added 1% penicillin streptomycin (Gibco #15070-063)
WORKFLOW
- Equilibrate phenol red free mTeSR1
- Add 60μl of NucBlue to 1 ml phenol red-free mTeSR
- Spin for 60min at 20,000g
- Add 100μl of NucBlue solution per well of 96-well plate
- Incubate at 37°C and 5% CO2 for 20min
- Dilute CellMask Deep Red with the NucBlue 1x solution (concentrations are stock dependent, see SOP)
- Add 100μl CellMask/NucBlue in addition to NucBlue solution to well
- Incubated at 37°C and 5% CO2 for 10min
- Wash with phenol red-free mTeSR
- Start high-resolution imaging immediately after washing
Integrated Cell
To determine the locations as well as morphologies of cellular structures, we generate images of cellular structures in reference to the nucleus (labeled with NucBlue) and the cell membrane (labeled with CellMask).
Integrated Cell >>
Integrated Cell >>
G. Imaging at the Resolution Limit |
Vertical Divider
For our applications, high image quality and information content are more important than high throughput. We optimized the microscope setup for optimal sectioning along the optical axes and maximum lateral resolution. We use different degrees of automation to balance reproducibility and manual quality control.
|
Instrumentation
WHAT MICROSCOPE TO USE?
The initial goals for the microscopy pipeline are:
We decided on spinning disk microscopes as the central part of the pipeline. To add more information to our data, we plan to build additional pipelines based on the Zeiss LSM 880 Airy fast, FCS, and image correlation techniques
- Quantify dimensions of structures
- Live cell imaging
- 3D imaging
- Optimized for optical quality
- High reproducibility
- Very robust
- Results are input for statistical modelling
- Wide-field microscopy: fast and reliable, but not 3D
- Deconvolution: fast and 3D, but potential to introduce processing artifacts
- Spinning Disk: robust, 3D, fast, but slower than wide-field microscopy
- Confocal point scanner (incl. NLO): robust and 3D, but slow (except for new implementations like the Carl Zeiss LSM 880 Airy fast)
- TIRF: very good optical sectioning, but limited to structures close to glass surface
- Conventional light sheet: low phototoxicity and high speed, but low spatial resolution and complex sample preparation
- Lattice light sheet: low phototoxicity and high imaging speed, but complex setup and slow sample exchange
- Structured Illumination Microscopy: high resolution but limited acquisition speed
- PALM/STORM: super-resolution but slow acquisition speed and limited 3D
- Scanning Probe Microscopy (STM, AFM, SNOM): super-resolution, but images only surfaces
- Fluorescence Correlation Spectroscopy (FCS) and Image Correlation Methods (e.g. RICS): very information rich but not suitable for structure visualization
We decided on spinning disk microscopes as the central part of the pipeline. To add more information to our data, we plan to build additional pipelines based on the Zeiss LSM 880 Airy fast, FCS, and image correlation techniques
THE ROLE OF PINHOLE
When imaging thick samples like monolayers of hiPSC, with a wide-field microscope, the structures in focus are blurred by out-of-focus light. A confocal microscope overcomes this limitation by rejecting out-of-focus light with a pinhole in the image plane in front of the detector. In the classical point scanning implementation, the system scans a focused laser beam line by line over the sample and records one pixel at a time. This setup creates very high-quality images but is relatively slow
http://www.microscopyu.com/articles/confocal/confocalintrobasics.html
Spinning disk microscopes overcome the speed limitation by scanning multiple beams in parallel. The image quality is lower than for point scanning microscopes and the optical sectioning capability is limited to thinner samples. hiPSC are thin (20μm) enough not to suffer from this limitation.
In a spinning disk microscope, the sample is illuminated through pinhole arrays in a fast spinning disk (Nipkow Disk). This disk creates a pattern of spots sweeping over the sample. Fluorescence or reflected light from the sample is collected through the same pinholes providing optical sectioning.
Typical implementations are:
- One disk with pinholes: simple and robust setup, but limited illumination efficiency and prone to stray light from back of disk
- Second disk with micro-lenses to focus excitation light at pinholes: better illumination efficiency but more complex and main dichroic close to imaging plane
- Micro-mirrors instead of lenses: issues with imaging quality
https://www.leica-microsystems.com/science-lab/hyvolution-super-resolution-imaging-with-a-confocal-microscope/
Optical sectioning (black, solid line), lateral resolution (black, dashed line), and light collection efficiency (green line), all depend on the diameter of the pinhole. Smaller pinholes decrease the thickness of the optical section, thus increase the resolution of the system along the optical axis. Less pronounced is the increase of lateral resolution for smaller pinholes. Smaller pinholes reject more light and thus the collected image is dimmer.
The diameter of a pinhole is measured in Airy Units (AU) and depends on the wavelength λ of the illumination light and the numerical aperture NA of the objective:
\[1AU = \frac{1.22\cdot \lambda }{NA} \]
For λ = 488nm (excitation for eGFP) and NA = 1.25 (high resolution water immersion objective) 1AU is 476nm. To calculate the physical dimension of the pinhole we multiply this value with the magnification of the optical system in front of the pinhole. E.g. a 1AU pinhole with a 100x Objective corresponds to a pinhole diameter of about 50µm.
For most applications, especially for live cell imaging, a pinhole diameter of 1AU is a good compromise between light efficiency and resolution. At one 1AU the system collects still 90% of the focal light intensity (see green curve) while the z-resolution does not increase significantly for a smaller pinhole.
Yokogawa manufactures two models of spinning disks with micro-lenses:
Literature:
Hideo, H., et al. (2008). New Technologies for CSU-X1 Confocal Scanner Unit. Yokogawa Technical Report English Edition. 45.
Wilhelm, S., et al. Confocal Laser Scanning Microscopy: Principles, Carl Zeiss.
Nyquist
Optical sectioning (black, solid line), lateral resolution (black, dashed line), and light collection efficiency (green line), all depend on the diameter of the pinhole. Smaller pinholes decrease the thickness of the optical section, thus increase the resolution of the system along the optical axis. Less pronounced is the increase of lateral resolution for smaller pinholes. Smaller pinholes reject more light and thus the collected image is dimmer.
The diameter of a pinhole is measured in Airy Units (AU) and depends on the wavelength λ of the illumination light and the numerical aperture NA of the objective:
\[1AU = \frac{1.22\cdot \lambda }{NA} \]
For λ = 488nm (excitation for eGFP) and NA = 1.25 (high resolution water immersion objective) 1AU is 476nm. To calculate the physical dimension of the pinhole we multiply this value with the magnification of the optical system in front of the pinhole. E.g. a 1AU pinhole with a 100x Objective corresponds to a pinhole diameter of about 50µm.
For most applications, especially for live cell imaging, a pinhole diameter of 1AU is a good compromise between light efficiency and resolution. At one 1AU the system collects still 90% of the focal light intensity (see green curve) while the z-resolution does not increase significantly for a smaller pinhole.
Yokogawa manufactures two models of spinning disks with micro-lenses:
- CSU-W1
- larger field of view
- Two disks with pinhole diameters of 50µm and 25µm
- Larger distance between pinholes to reduce lateral light crosstalk on thick samples
- CSU-X1
- One disk with pinhole diameters of 50µm
- Higher pinhole density
- Faster rotation speed of disk
- Robust
Literature:
Hideo, H., et al. (2008). New Technologies for CSU-X1 Confocal Scanner Unit. Yokogawa Technical Report English Edition. 45.
Wilhelm, S., et al. Confocal Laser Scanning Microscopy: Principles, Carl Zeiss.
Nyquist
NYQUIST SAMPLING
The resolution of a camera based light microscope is limited by optical diffraction and the pixel size of the camera chip.
The optical resolution of a microscope is given by the wavelength λ of the light used and the numerical aperture NA of the objective. According to Rayleigh the resolution limit is
\[r_{Airy} = 0.61\frac{\lambda }{NA}\]
For λ = 488nm (excitation for eGFP) and NA = 1.25 (high resolution water immersion objective), rAiry is about 240nm. Thus, the spinning disk microscope we use can distinguish two structures 240nm apart.
To be able to distinguish these structures in a microscope image, the pixel size of the camera needs to be small enough. In our system we use an objective with 100x magnification. Thus, two structures the optics of the microscope can just resolve, will appear 24μm (=240nm*100) apart on the camera chip. Each pixel on the chip we are using is 6.5µm x 6.5μm large and can very well resolve the structures.
A camera with such a small virtual pixel size collects only a few photons per pixel. The accuracy of each photon detector is limited by the fundamental quantum mechanical Poisson or statistical photon noise. The signal-to-noise ratio (SNR) for N photons counted is given by
\[SNR = \frac{N }{\sqrt{N}} = \sqrt{N}\]
Thus, images collected with cameras with larger pixels that receive more photons are less noisy.
Nyquist derived for non-periodic data that the sampling frequency should be at least 2.4x higher than the highest frequency in the data. For microscope images that translates into a pixel size that should be 2-3 times smaller than the optical resolution limit. To achieve this in our setup, we bin 2x2 pixels. This results in an effective pixel size of 13µm x 13µm. Using an additional 1.2x magnifier in front of the camera brings us very close to the Nyquist criterion while collecting sufficient photons to overcome Poisson noise. The camera has a similar resolution as the optical resolution of the system. If we use smaller pixels we will collect less photons per pixel and the signal will be noisier.
Literature:
Pawley, J. B. (2006). Handbook of Biological Confocal Microscopy. New York, Springer Science + Business Media. Chapters 1, 2, 4
Overview
WORKFLOW
- Keep environmental chamber and stage incubator at 37°C, saturated humidity, 5% CO2
- Setup system for
- Transmitted light (exposure time 100ms)
- Fluorescence (exposure time 200ms, empty channel with exposure time of 33ms between each channel)
laser power at sample measured with 10x/0.45NA
- i.405nm: 0.28mW
ii.488nm: 2.3mW
iii.638nm: 2.4mW - Switch to C-Apochromat 100x/1.25NA water immersion objectives
- Add immersion water
- Start system to automatically acquire z-stacks at positions selected above with 10x tile scan
- Acquire images of dye controls for flatfield correction
- Acquire image of beads
- Collect black reference image
Limit data acquisition to one hour per well to avoid toxic effects of organic dyes and light.
H. Large Scale Image Processing |
Vertical Divider
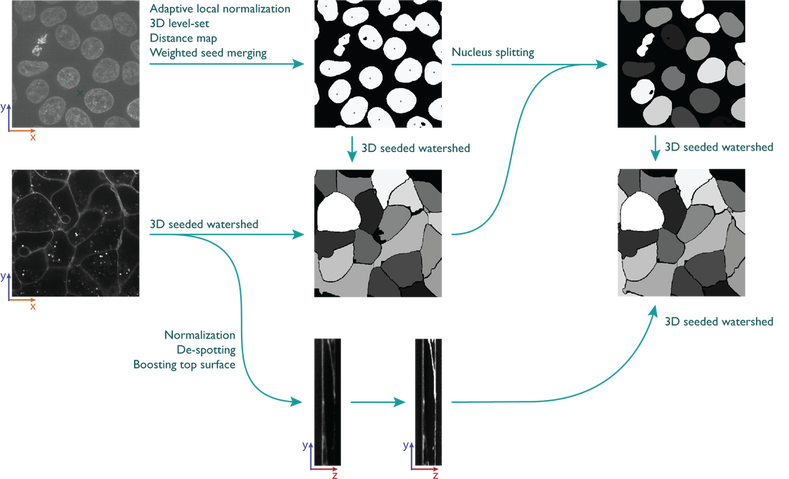
All cells are part of cell colonies. To analyze individual cells, we segment the cells based on the cell membrane label, the nucleus based on DNA stain, and structure of interest based on its EGFP signature. To process large numbers of images we implemented our processing pipeline on a cluster in CellProfiler under the control of Airflow.
|
Instrumentation
CELLPROFILER
CellProfiler is an open-source platform for high-content image processing. It was developed by the Broad Institute and is available at http://cellprofiler.org/.
CellProfiler provides:
CellProfiler provides:
- Advanced modules for image processing
- Measurement and feature extraction modules
- True 3D image processing (new in CellProfiler 3.0)
- Graphical user interface to build sequential processing pipelines
- Extensive help features
- Head-less mode for cluster processing
AIRFLOW
Airflow is a workflow management system. We use Airflow to combine processing modules written in Python, MatLab, and CellProfiler and to execute them on our in-house cluster.
Airflow is:
Airflow is:
- Based on Directed Acyclic Graphs (DAG)
- Open source (Apache)
Overview
WORKFLOW
Nuclear segmentation in 3D:
Plasma membrane segmentation in 3D:
De-clump nuclei
Link: Extracting Information
- Median filter on nuclear channel
- Adaptive local normalization
- Active contour
- Reduce nucleus to one pixel to be used as seed in membrane segmentation
Plasma membrane segmentation in 3D:
- Median filter on membrane channel
- Remove offset
- Remove speckles
- Adaptive local normalization
- 3D watershed with seeds from nucleus segmentation
De-clump nuclei
- Use membrane outlines to separate merged nuclei
Link: Extracting Information
I. Data Sharing |
Vertical Divider
Out of responsibility to users of our data, we openly distribute only high-quality data sets that has been manually curated. Non-curated data is available upon request.
|
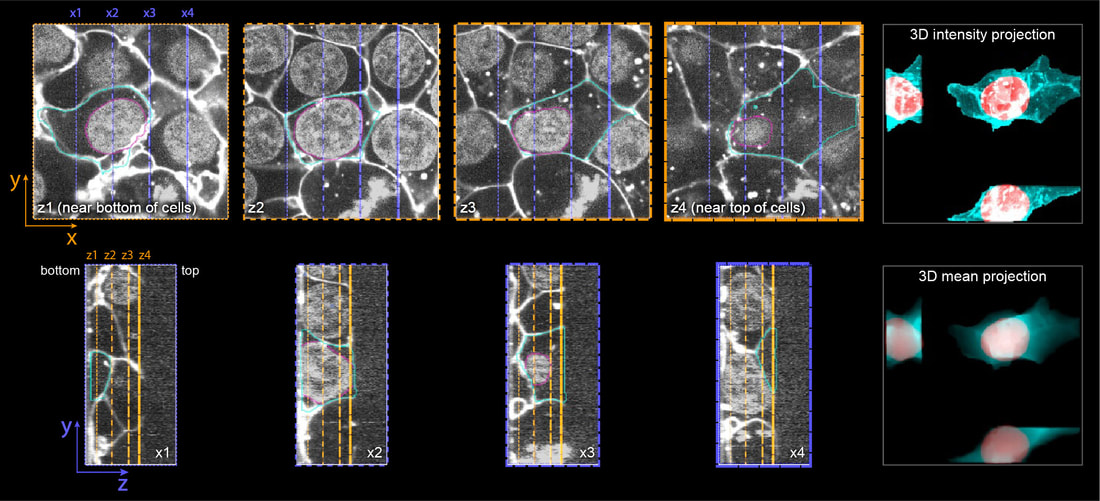
We visually inspect each segmented cell for segmentation accuracy and other technical issues.