Get started teaching with resources that are particularly popular with educators. This quick-start guide for teachers provides in-depth tips for new users, detailed information on how to view and interact with data online, and use cases for each resource in classrooms and curricula.
All of our resources feature data derived from human cells, and all of the tools featured for educators can be used entirely online, with no software or downloading required.
All Allen Institute for Cell Science resources are based on our fluorescently labeled human induced pluripotent stem cells (hiPS cells), which enable scientists to precisely visualize one or several cell structures while the cell functions normally. For a brief overview of our research goals, process, and cells, see What We Do.
Visual Guide to Human Cells
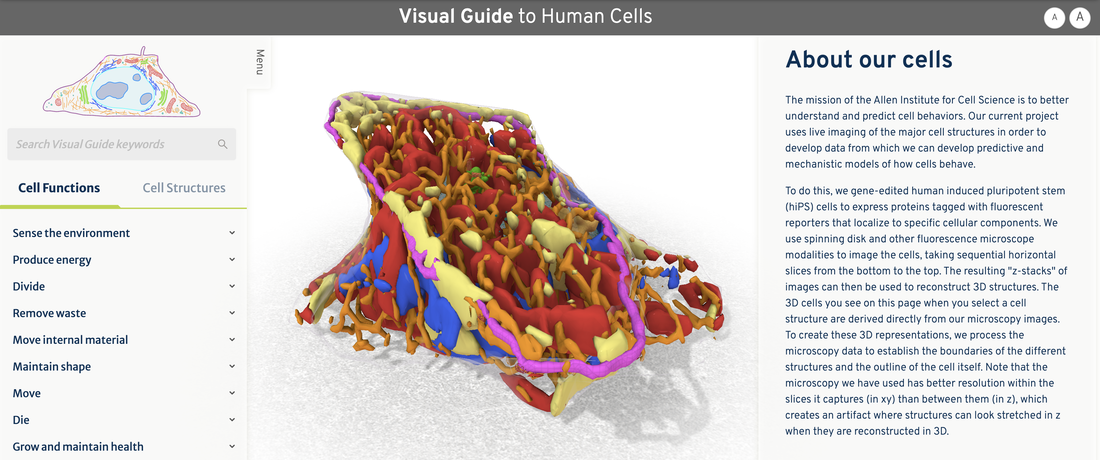
Overview: This interactive resource displays major cell structures and describes their functions in an annotated model of a real human cell. The cell contains 14 structures that were derived from our microscopy image data via direct segmentation, (three structures), machine-learned models (seven structures), or that were modeled in by a scientific illustrator using 3D animation software (three structures). The annotated cell model is accompanied by microscope images and videos, illustrations and written explanations describing each structure's anatomy and function, as well as an additional 84 3D models that display each structure undergoing each stage of mitosis.
Primary audience level: This resource is written broadly for biologists and students as a self-guided reference. It is well suited for students in high school and college, but can be presented to learners of any level by a teacher possessing an advanced knowledge of cellular and molecular biology.
Classroom applications: This resource may be particularly useful for overviewing cell anatomy and physiology or for guiding more advanced students through the transition from textbooks/cell diagrams to the types of cell images found in journal publications. It also serves as a reference that can reinforces the relationship between cell structures and structure functions in an interactive format.
Interpretation and use: The explanatory text in this interactive resource describes how the model cell was generated from real human cell data. Students can browse cells structures by their function, or search for specific structures directly.
Citation: Allen Institute for Cell Science (2017). Visual Guide to Human Cells [interactive resource]. Available from allencell.org/visual-guide-to-human-cells.
Primary audience level: This resource is written broadly for biologists and students as a self-guided reference. It is well suited for students in high school and college, but can be presented to learners of any level by a teacher possessing an advanced knowledge of cellular and molecular biology.
Classroom applications: This resource may be particularly useful for overviewing cell anatomy and physiology or for guiding more advanced students through the transition from textbooks/cell diagrams to the types of cell images found in journal publications. It also serves as a reference that can reinforces the relationship between cell structures and structure functions in an interactive format.
Interpretation and use: The explanatory text in this interactive resource describes how the model cell was generated from real human cell data. Students can browse cells structures by their function, or search for specific structures directly.
- The data used to generate the model comes from our fluorescent cell lines, which each tag a protein associated with a specific cell structure and dyes to label the DNA and cell membrane; the tagged proteins selected to label each structure are named along with the structure.
- For each cell structure, students can read an explanation written for high school level biology students of what that structure does, watch microscope videos of cells with that structure fluorescently tagged, and step the model through the stages of mitosis.
Citation: Allen Institute for Cell Science (2017). Visual Guide to Human Cells [interactive resource]. Available from allencell.org/visual-guide-to-human-cells.
Integrated Mitotic Stem Cell
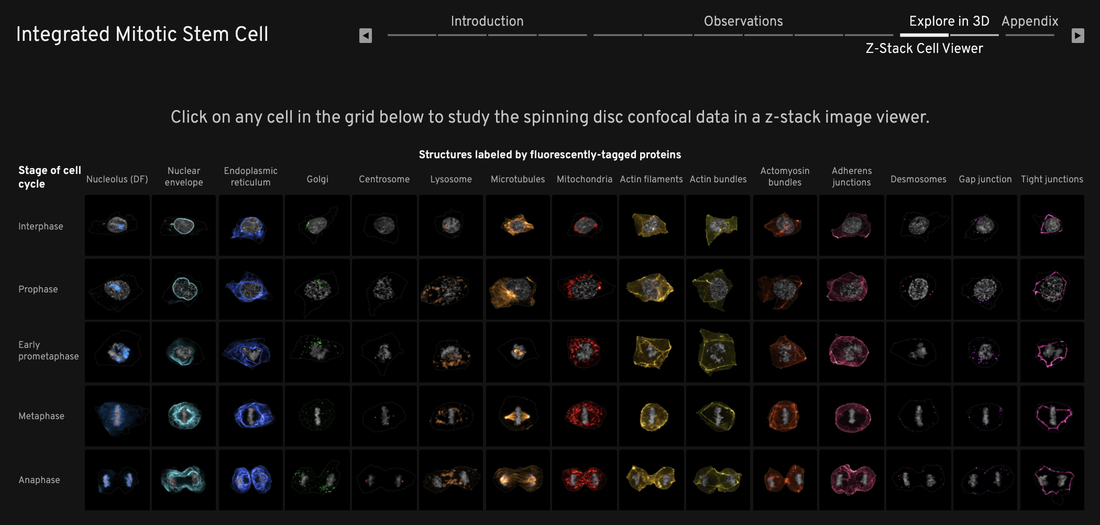
Overview: This visual essay introduces an advanced data-driven model and visualization tool that captures human cell division by integrating 3D data from 75 single-cell images. The model and the visualizations in the essay follow 15 cell structures through the whole cell cycle.
Primary audience level: This resource is written broadly for biologists and students as a self-guided reference. It is well suited for students in high school and college.
Classroom application: This visual essay can be used to follow and reinforce an introduction to the stages of mitosis by introducing imagery and demonstrating how the cell structures fit together during mitosis. The 3D viewer <direct link> and the Z-stack viewer <direct link> can also be used by biology teachers to describe cell and cell organelle/structure anatomy across the major stages of the cell cycle.
Interpretation and use: To use this visual essay, just follow the prompts on screen to scroll through. To explore additional quantitative representations of data like those shown in the interactive portions of the essay, visit the Cell Feature Explorer (cfe.allencell.org).
Citation: Allen Institute for Cell Science (2019). Integrated Mitotic Stem Cell [cell model and visualization tool]. Available from imsc.allencell.org.
3D cell viewer
Overview: Browse and view this collection of almost 25,000 individual human cells, as well as over 7,000 cell colonies.
Primary audience: This viewer enables access to our research-grade collection of tens of thousands of human cells, suitable for students at the high school level and up as well as professionals.
Classroom applications:
Primary audience: This viewer enables access to our research-grade collection of tens of thousands of human cells, suitable for students at the high school level and up as well as professionals.
Classroom applications:
- Students can explore 3D images of tens of thousands of real human cells, both in isolation to see details and in colonies to see how they grow in the lab. Engaging, 3D volumetric visualization tools enable students to perform basic biological visual image analysis of 3D cell volumes directly in a web browser: for example, they can rotate, zoom, change image colors, and adjust brightness/contrast to interpret 3D spatial relationships of cells and subcellular components.
- For a ready-to-use activity using the 3D Cell Viewer, try our Introduction to Microscopy in Biology (high school level) or A virtual laboratory on cell division using a publicly-available image dataset (college level) lesson.
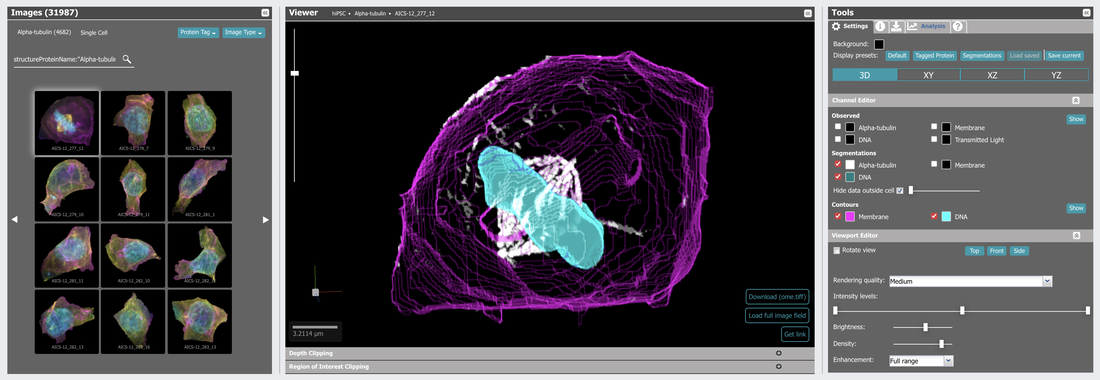
- For first time users, click on [Image Type:] to select [Single cell] and then click [Protein tag] to select a protein to visualize, for example alpha-tubulin, a component of microtubules, displays particularly dramatic images. Each option under [Protein tag] fill the gallery with 3D images of a particular cell line – that has one fluorescent protein labeling a particular cell structure as well as fluorescent dyes labeling the DNA and cell membrane that will appear in different colors in the 3D viewer. All cells are derived from the same wild-type human cell line and have the same physical properties other than that fluorescent label.
- Students can search online to learn which cell structures the named proteins are associated with, or consult the Visual Guide to Human Cells, which explains the link between the tagged proteins and the cell structures. Our newer Cell Feature Explorer also lists the labeled structures by their name, instead of only listing the more esoteric protein name.
- The display presets show a colorized version of the three fluorescently labeled components of the cell. In addition to the fluorescent tag attached to the protein named in the cell information, fluorescent dyes show the presence of DNA and membrane. Each button in the channel editor toggles on/off a different volume of pixels, including the Observed data, which is collected from the microscopes, and the Segmentations and Contours, which are two ways to view the same information extracted from the Observed data. For another view option, select Display presets: “Segmentations” to see a “cleaner” interpretation of the data Observed channels and turns on particular Segmentation or Contour channel options. To produce the segmentation data, algorithms are used to determine where to draw a boundary around each of the structures that otherwise look “soft” in the “Observed” data channels (shown below). Use the slider to the left of the image or a mouse wheel to zoom. Click on the image stop it from rotating or click and drag to rotate it to any orientation.
- Use the gallery to select other images to view. By default, additional images will load with the image settings that are already in place.
Cell Feature Explorer
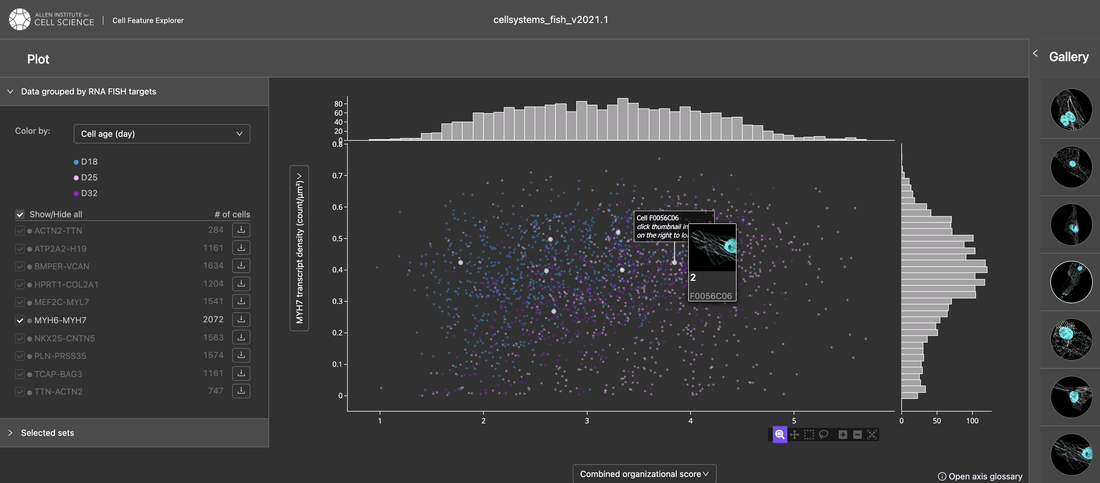
Overview: Plot quantitative features (measurements made on the cells or derived from other dimensionality reduction methods such as principal component analyses) on an interactive graph and view 3D images of hundreds of thousands of individual human cells.
Primary audience: This viewer enables access to and analysis of several of our research-grade collections of human cells, including hiPSCs and differentiated cardiomyocytes. This tool is suitable for students at the high school level and up as well as professionals.
Classroom applications:
Interpretation and use:
Citation: Allen Institute for Cell Science ([year indicated on selected dataset]). Cell Feature Explorer – [Name of selected dataset]. Available from cfe.allencell.org.
Primary audience: This viewer enables access to and analysis of several of our research-grade collections of human cells, including hiPSCs and differentiated cardiomyocytes. This tool is suitable for students at the high school level and up as well as professionals.
Classroom applications:
- Students can explore the relationship between various properties of the cell (e.g. cellular volume, nuclear volume, stage of mitosis, etc.) with an interactive graph, and connect those observations to the images of cells the data points in the interactive graph were derived from. The Cell Feature Explorer also includes all the features of the 3D Cell Viewer for performing visual analysis of 3D cell volumes directly in a web browser (rotate, zoom, change image channel colors, and adjust brightness/contrast to interpret 3D spatial relationships of cells and subcellular components).
- For a ready-to-use activity using the Cell Feature Explorer, try our Mitosis and Microscopy (high school level) lesson.
Interpretation and use:
- First select a dataset. First-time users should choose the hiPSC Single-Cell Image Dataset of any version where many common and easy to interpret measurements have been made on each cell and its internal structure, such as surface area and volume. Each color coded dot on the graph represents one cell line, which has one fluorescent protein labeling a particular cell structure as well as fluorescent dyes labeling the DNA and cell membrane that will appear in different colors in the 3D viewer. All cells are derived from the same wild-type human cell line and have the same physical properties other than that fluorescent label. Select one or more cell structures to include in the graph from the list on the left (default – all structures). All of these cells have had several basic properties of the cell measured and labeled.
- Students can explore the relationship between different quantified cell properties using the dropdown menus on each axis of the graph. The option “Interphase and mitotic stages” is particularly useful for students – this will sort cells into their stages of mitosis based on expert labeling and classification algorithms.
- At any time, click on a dot on the graph to bring up that cell image in the gallery at right. Select any cell image in the gallery to see it larger in the 3D viewer below.
- This visualization tool is a version of the 3D Cell Viewer. All tips and tools from the 3D Cell Viewer also apply to the version here.
Citation: Allen Institute for Cell Science ([year indicated on selected dataset]). Cell Feature Explorer – [Name of selected dataset]. Available from cfe.allencell.org.
Cell Structure Observations
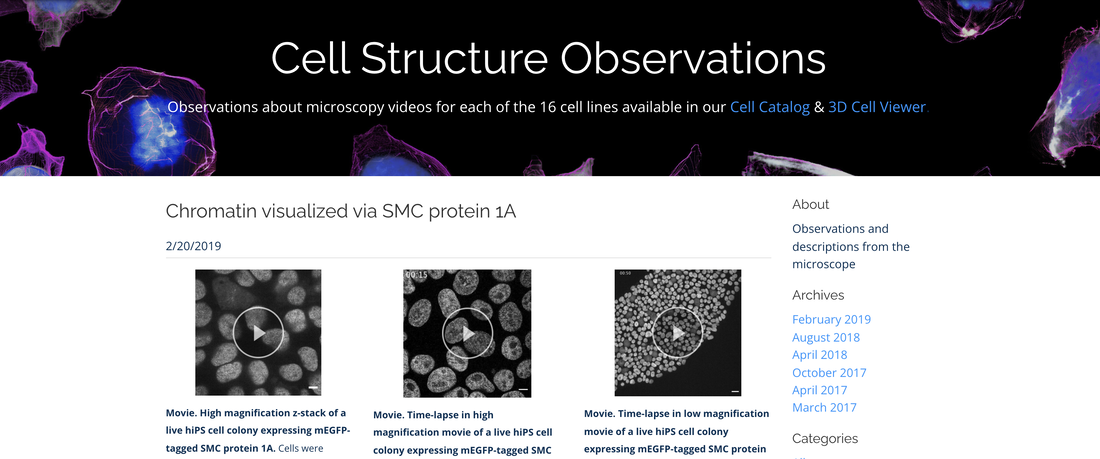
Overview: Observations about cell behavior seen in select cell lines, through both images and video, demonstrate the function of cell structures through vivid visualizations. The cells observed in these images are each tagged with a fluorescent protein highlighting the named cell structure.
Primary audience level: This resource is geared towards professionals. It may be suitable for advanced, highly engaged students and for teachers with advanced knowledge.
Classroom applications: Teachers may find this page to be a useful source of images to use in presentations, lab demos, and more. To download videos for use in presentations, press play and then right click on the video. From the menu, select “Save video.”
Interpretation and use: Many of the cell movies on this page scroll through a “Z-stack” of images from our microscopes. These movies do not show the cells moving over time, but instead are scrolling from the bottom to the top of a 3D stack of image slices capture cross sections of the semi-transparent cells at different distances from the glass or plastic substrates on which they grow. This series of images is then stacked to form a digital 3D volume of pixels (called voxels) to recreate the 3D cells from which they were captured. CT scans and MRIs use a similar process to capture and visualize medical volumetric data.
Citation: Cite videos following this formula, replacing text in italics with information for that video:
Allen Institute for Cell Science (listed year). Video title [microscopy movie]. Available from allencell.org/cell-observations.