Golgi visualized via sialyltransferase 1 (also known as ß-galactoside α-2,6-sialyltransferase1)10/5/2017
Figure 1. Z-stack movies of Golgi. A) Z-stack of live hiPS cells expressing one copy (monoallelic) of mEGFP-tagged sialyltransferase 1 (ST6GAL1) imaged on a spinning-disk confocal microscope. Movie starts at the bottom of the cells and ends at the top. B) Z-stack of live hiPS cells expressing two copies (biallelic) of mEGFP-tagged sialyltransferase 1 (ST6GAL1) imaged on a spinning-disk confocal microscope. Movie starts at the bottom of the cells and ends at the top. Contrast settings for these two movies are identical to highlight the increased signal in the biallelic edited line (right). C) Z-stack of live hiPS cells expressing two copies (biallelic) of mEGFP-tagged sialyltransferase 1 (ST6GAL1; white) stained for DNA (NucBlue Live; cyan) and plasma membrane (CellMask Deep Red; magenta). Movie starts at the bottom of the cells and ends at the top.
Figure 2. Timelapse movies of Golgi. A) Timelapse movie of hiPS cells expressing two copies (biallelic) of mEGFP-tagged sialyltransferase 1 (ST6GAL1). Images were taken in 3D every 3 min for 6 hrs on a spinning-disk confocal microscope. Images are maximum intensity projections with the ‘despeckle’ ImageJ filter applied. Playback speed is 1800x real time. B) Timelapse movie of hiPS cells expressing two copies (biallelic) of mEGFP-tagged sialyltransferase 1 (ST6GAL1). Images were taken in 3D every 5 min for 100 min on a spinning-disk confocal microscope. Images are maximum intensity projections with the ‘despeckle’ ImageJ filter applied. Playback speed is 900x real time. Observations
Figures. Z-stack and timelapse movies of lysosomes. A) Z-stack of live hiPS cells expressing mEGFP tagged LAMP1 imaged on a spinning-disk confocal microscope. Movie starts at the bottom of the cells and ends at the top. Scale bar = 5µm. B–C) Timelapse movie of live hiPS cells expressing mEGFP-tagged LAMP1. Images were taken as a single slice near the top (B) or bottom (C) of the cell every 1 sec for 100 sec on a spinning-disk confocal microscope. Images have had the ‘despeckle’ ImageJ filter applied. Movie sped up 10x real time. Scale bar = 5 µm.
Observations
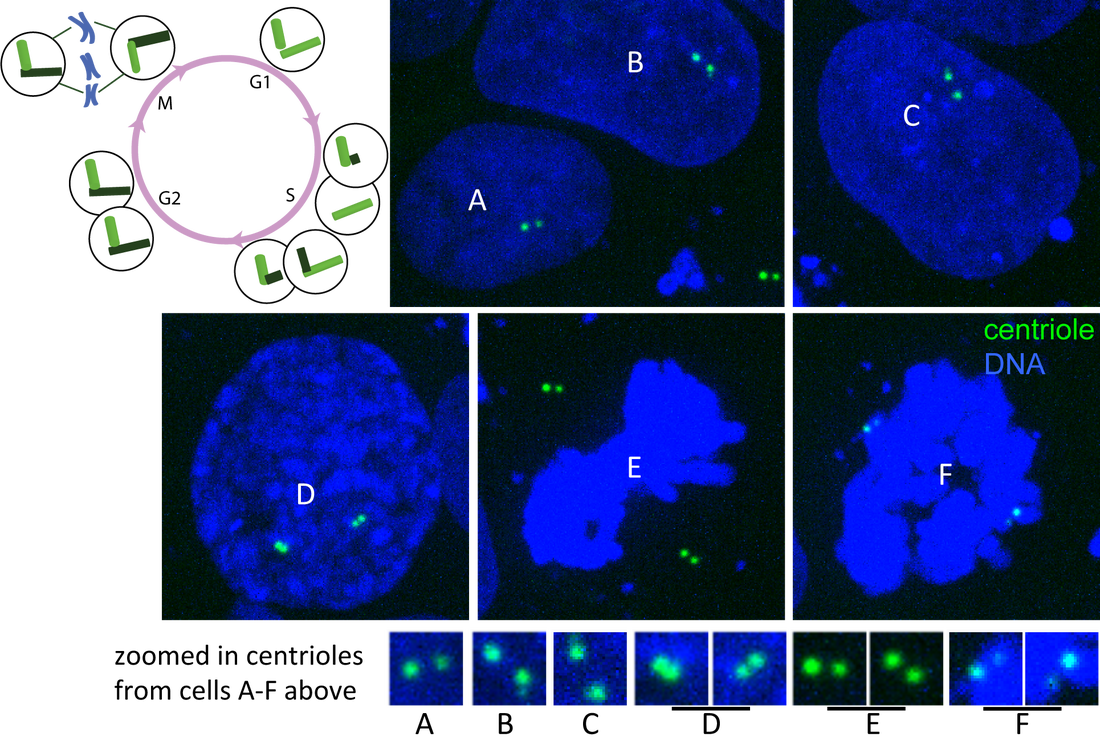
Figure. Centrin and DNA through cell cycle. Single plane images of hiPS cells expressing mTagRFP-T–tagged centrin (green) and labeled with Hoechst dye (DNA; blue) imaged on a spinning-disk confocal microscope. Cells labeled A-F represent different stages of the cell cycle (see diagram). A) G1-phase, B) early S-phase, C) later S-phase, D) G2/M-phase and E–F) M-phase contain centrioles at distinguishable stages of duplication (see zoomed in images and cell cycle diagram).
Observations
|
AboutObservations and descriptions from the microscope Archives
February 2019
Categories
All
|
The Institute |
Legal |
Help & contact |
Follow Us
|
Copyright © 2024 Allen Institute. All Rights Reserved.
|
|
See more on alleninstitute.org
|


 RSS Feed