|
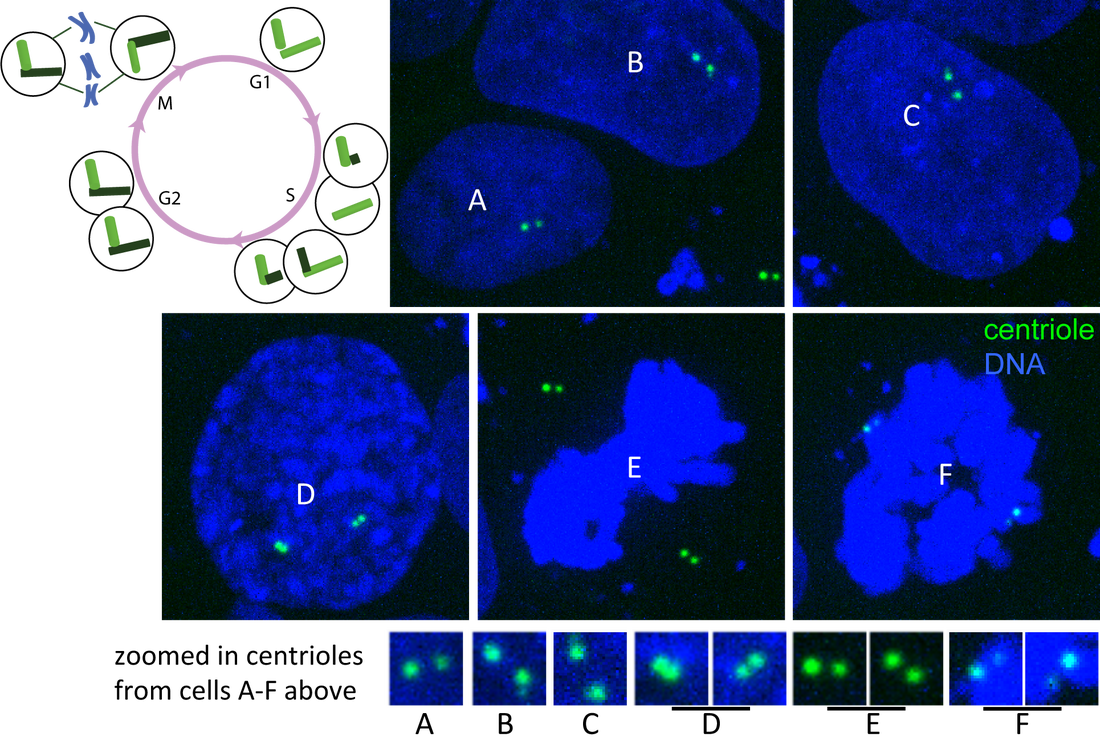
Figure. Centrin and DNA through cell cycle. Single plane images of hiPS cells expressing mTagRFP-T–tagged centrin (green) and labeled with Hoechst dye (DNA; blue) imaged on a spinning-disk confocal microscope. Cells labeled A-F represent different stages of the cell cycle (see diagram). A) G1-phase, B) early S-phase, C) later S-phase, D) G2/M-phase and E–F) M-phase contain centrioles at distinguishable stages of duplication (see zoomed in images and cell cycle diagram).
Observations
Z-stack with overlay Low magnification timelapse Figure. Movies of desmoplakin in desmosomes. Top: Z-stack of live hiPS cells expressing mEGFP-tagged desmoplakin imaged on a spinning-disk confocal microscope. Images start from the bottom of the cells and end at the top. The right panel shows the left panel overlaid onto the equivalent transmitted light image. Bottom: timelapse movie of a hiPS cell colony expressing mEGFP-tagged desmoplakin. Images were collected in 3D every 4 minutes for 8 hours on a spinning-disk confocal microscope. Images are maximum intensity projections; playback speed is 2400x real time.
Observations
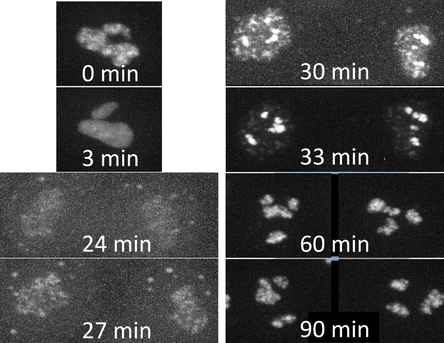
Figure 1. Movies of fibrillarin in Nucleoli. Left: Z-stack of live hiPS cells expressing mEGFP tagged fibrillarin imaged on a spinning-disk confocal microscope. Images start from the bottom of the cells and end at the top. Right: Timelapse movie of live hiPS cells expressing mEGFP tagged fibrillarin. Images were collected in 3D every 3 minutes for 1.5 hours on a spinning-disk confocal microscope. Image is a maximum intensity projection. Playback speed is 900x real time. Figure 2. Time series of cell division. A single cell going through cell division taken from the movie on the right. Observations
Figure. Movies of α-tubulin in microtubules. Top left: Z-stack of live hiPS cells expressing mEGFP-tagged α-tubulin imaged on a spinning-disk confocal microscope. Images start from the bottom of the cells and end at the top. Top center and right: Timelapse movies of a hiPSC colony expressing mEGFP-tagged α-tubulin imaged on a spinning disk confocal microscope. Center: images were collected in 3D every 4 minutes for 400 minutes. Images are maximum intensity projections; playback speed is 1200x real time. Top right: images were collected as a single slice near the top of the cell every 1 minute for 65 minutes; playback speed is 900x real time. Bottom row: 3D reconstructions of hiPS cells expressing mEGFP-tagged α-tubulin to visualize both the general organization of microtubules within the cell and the primary cilia at the top of cells.
Observations:
|
AboutObservations and descriptions from the microscope Archives
February 2019
Categories
All
|
The Institute |
Legal |
Help & contact |
Follow Us
|
Copyright © 2024 Allen Institute. All Rights Reserved.
|
|
See more on alleninstitute.org
|


 RSS Feed