ALLEN CELL EXPLORER
  • About
      Institute
      1. News feed
      2. What we do
      3. Publications
      4. Allen Institute | allenInstitute.org
      5. Careers
      Site
      1. Home page
      2. Site updates
      3. Archived content
  • Allen Cell Collection
      Order cells & plasmids
      1. Cell Catalog
      2. Cell Catalog quickview
      3. Cell Shorts (documentaries on labs using our cells)
      4. Support forum
      Lab methods
      1. Instructional videos for success in the lab
      2. Standard operating procedures (written methods)
      3. Illustrated overviews
      About our hiPS cells
      1. hiPS Cell Structure Overview
      2. Visual Guide to Human Cells
      3. Cell structure observations
      4. Why endogenous tagging?
      5. Differentiation into cardiomyocytes
      6. Genomics
      7. Download cell data (images, genomics, features)
  • Data & Digital Tools
      Online image analysis
      1. Cell Feature Explorer (plotting & 3D viewer)
      2. 3D cell viewer (pre2018)
      3. Deep cell zoom (216,016 cells)
      Online modeling viewers
      1. Visual Guide to Human Cells
      2. Simularium (4D visual analysis)
      3. Integrated Mitotic Stem Cell
      4. └ Z-stack viewer
      5. └ 3D viewer
      6. Allen Integrated Cell viewer
      7. Label-free examples viewer
      8. 3D probabilistic model viewer
      Desktop tools
      1. Allen Cell & Structure Segmenter
      2. AGAVE 3D pathtrace image viewer
      Data & code
      1. Download cell data (images, genomics, features)
      2. Code repositories & software
  • Analysis & Modeling
      Allen Integrated Cell models
      1. Overview
      2. Integrated Mitotic Stem Cell
      3. └ Z-stack viewer
      4. └ 3D viewer
      5. Label-free Determination
      6. └ 3D viewer
      7. 3D Probabilistic Modeling
      8. └ 3D viewer
      9. Visual Guide to Human Cells
      4D biology models
      1. Simularium (online 4D viewer)
      Methodologies
      1. Drug perturbation pilot study
      2. hiPS cells during mitosis
      3. Differentiation into cardiomyocytes
  • Publications
      Articles
      1. All journal publications
      2. Preprints (biorxiv, arxiv)
      Posters
      1. Select posters
  • Education
      Education resources
      1. All Resources
      2. Teaching materials
      Online tools popular with teachers
      1. Visual Guide to Human Cells
      2. Integrated Mitotic Stem Cell
      3. Cell Feature Explorer (interactive plotting & 3D viewer)
      4. 3D cell viewer (pre2018 data)
      5. hiPS cell structure overview
  • Support
      Questions
      1. FAQs
      2. Forum
      Tutorials for digital tools
      1. Digital tool tutorials with videos
      2. Visual Guide tutorial
      3. AGAVE user guide
      Lab methods
      1. Instructional videos for success in the lab
      2. Standard operating procedures (written methods)
      3. Illustrated overviews
  • 🔍
      SEARCHBAR

Cell Structure Observations

Observations about microscopy videos for each of the 16 cell lines available in our Cell Catalog & 3D Cell Viewer.

Chromatin visualized via SMC protein 1A

2/20/2019

 
Movie. High magnification z-stack of a live hiPS cell colony expressing mEGFP-tagged SMC protein 1A. Cells were imaged in 3D on a spinning-disk confocal microscope. Movie starts at the bottom of the cells and ends at the top. Scale bar, 5µm.
Movie. Time-lapse in high magnification movie of a live hiPS cell colony expressing mEGFP-tagged SMC protein 1A. Cells were imaged in 3D on a spinning-disk confocal microscope every 3 min. A single mid-level plane is shown. Frames were histogram matched to adjust for photobleaching. Movie plays at 900x real time. Scale bar, 5 µm.
Movie. Time-lapse in low magnification movie of a live hiPS cell colony expressing mEGFP-tagged SMC protein 1A. Cells were imaged in 3D on a spinning-disk confocal microscope every 5 min. A single mid-level plane is shown. Movie plays at 3000x real time. Scale bar, 20 µm.
Observations
  • SMC protein 1A is encoded by the X-linked gene SMC1A and escapes X-chromosome inactivation.
  • SMC protein 1A is part of the cohesin complex. Cohesin is important for controlling chromosomal shape and organization in interphase and mitosis. Cohesin is best known for its role in joining sister chromatids during part of the cell cycle between DNA replication and anaphase so that that chromatids are properly distributed between daughter cells.
  • In hiPS cells, SMC protein 1A has a granular appearance throughout the nucleus and is largely excluded from the nucleolus. SMC protein 1A reorganizes during cell division, forming puncta that align at the center of the spindle (consistent with localization to centromeres), localizing in a diffuse haze at anaphase, and reappearing in a granular distribution in the nucleus as the nucleus is reassembled. 

Sarcomeric thick filaments via MLC-2v

2/20/2019

 
Movie.  High magnification Z-stack of live hiPSC-derived cardiomyocytes expressing mEGFP-tagged MLC-2v. Twelve days after the onset of differentiation, cells were plated on PEI- and laminin-coated glass and imaged in 3D on a spinning-disk confocal microscope 28 days later (40 days total after the onset of differentiation). Cells were treated with 20 mM of the myosin inhibitor 2,3-butanedione monoxime (BDM) to prevent beating during image acquisition. Inset is a 3x enlargement of the boxed region to show detail of MLC-2v in myofibrils. Movie starts at the bottom of the cells and ends at the top. Scale bar, 20 µm.
Movie. Time-lapse in high magnification movie of live hiPSC-derived cardiomyocytes expressing mEGFP-tagged MLC-2v protein. Twelve days after the onset of differentiation, cells were plated on PEI and laminin coated glass and imaged on a spinning-disk confocal microscope 28 days later (40 days total after the onset of differentiation). A single plane of cells was imaged continuously with a 100 ms exposure time. Inset is a 3x enlargement of the boxed region to show detail of MLC-2v in myofibrils. Movie plays in real time.Scale bar, 20 µm.
Observations
  • MLC-2v is the cardiac ventricular isoform of the Myosin Light Chain 2 (MLC-2) protein. It localizes to the thick filament of the sarcomere where it binds to the myosin heavy chain and functions to regulate myosin-based contractility. The expression of MLC-2v is developmentally regulated; it is frequently used as a marker of cardiac development due to its up-regulation with ventricular development.
  • In hiPSC-derived cardiomyocytes, we observed mEGFP-tagged MLC-2v in a striated appearance along myofilaments, reflecting its localization to the thick filaments of sarcomeres, and absence from the Z-disk and I-band. During cardiomyocyte beating, the contraction of sarcomeres can be seen in the changes in spacing between striations, and some myofibrils buckle.

Paraspeckles and stress granules via RNA-binding protein FUS

2/20/2019

 
Movie. High magnification Z-stack of a live hiPS cell colony expressing mEGFP-tagged RNA-binding protein FUS in control cells (left panel) and in the presence of 500 µM sodium arsenite for 15 min (right panel). Cells were imaged in 3D on a spinning-disk confocal microscope. Movie starts at the bottom of the cells and ends at the top. Scale bar, 5µm.
Movie. High magnification Time-lapse movie of a live hiPS cell colony expressing mEGFP-tagged RNA-binding protein FUS. Six minutes after the introduction of 500 µM sodium arsenite, cells were imaged every 5 sec in 3D on a spinning-disk confocal microscope. A single mid-level plane is shown. The inset is a 2.5x enlargement of the boxed region to show detail of aggregate formation. Frames were histogram matched to adjust for photobleaching. Movie plays at 25x real time. Scale bar, 5 µm.
Observations
  • RNA-binding protein FUS (Fused In Sarcoma) is a DNA/RNA binding protein involved in transcription, mRNA splicing and transport, and DNA repair. 
  • FUS forms various condensed-phase compartments in cells. In the absence of a stressor, FUS compartments form in the nucleus, including at sites of active genes, DNA damage, and paraspeckles (RNA-protein bodies in the interchromatin space). Stressful conditions (e.g. generation of reactive oxygen species (ROS)) lead to a redistribution of FUS from the nucleus to the cytoplasm, where it localizes to stress granules.
  • In unstressed hiPS cells imaged with spinning-disk light microscopy, mEGFP-tagged FUS has a granular appearance within the nucleoplasm including some relatively bright spots which may be paraspeckles. In the absence of a stressor, there is no mEGFP-tagged FUS in the cytoplasm. 
After the application of the stressor sodium arsenite to hIPS cells, mEGFP-tagged FUS appears as puncta in the cytoplasm that join together, reflecting stress granule nucleation and coalescence. Concurrently, the intensity of FUS decreases in the nucleoplasm.​

​Cell–cell contacts: desmosomes visualized via desmoplakin

3/21/2017

 
Z-stack with overlay
Low magnification timelapse
Figure. Movies of desmoplakin in desmosomes. Top: Z-stack of live hiPS cells expressing mEGFP-tagged desmoplakin imaged on a spinning-disk confocal microscope. Images start from the bottom of the cells and end at the top. The right panel shows the left panel overlaid onto the equivalent transmitted light image. Bottom: timelapse movie of a hiPS cell colony expressing mEGFP-tagged desmoplakin. Images were collected in 3D every 4 minutes for 8 hours on a spinning-disk confocal microscope. Images are maximum intensity projections; playback speed is 2400x real time.

Observations
  • Desmoplakin is involved in the linkage of intermediate filaments to cell-cell adhesion sites (desmosomes) in epithelial cells. These desmosomes are seen as small puncta at apical cell-cell boundaries.
  • In hiPS cells, desmoplakin puncta are not visible in all cells. However, when present there are between 1 and ~20 puncta present per cell.
  • There may be position-dependent differences in number of desmosomes depending on the spatial location of a cell within a colony. For example, we observe differences between the number of desmosomes in the tightly-packed centers of colonies vs. the flatter, less epithelial-like cells at the edges of colonies; however, this is a casual rather than a rigorous observation.
  • Desmosomes stay intact during cell division

Actin structures visualized via ß-actin, α-actinin, & actinomyosin

3/21/2017

 
ß-actin
α-actinin
Myosin IIB
Figure. Movies of ß-actin, α-actinin & actinomyosin in various actin structures. Top row movies: Z-stacks of live hiPS cells expressing mEGFP-tagged ß-actin (left), α-actinin (center) and non-muscle myosin heavy chain IIB (right) imaged on a spinning-disk confocal microscope. Images start from the bottom of the cells and end at the top. 
Picture
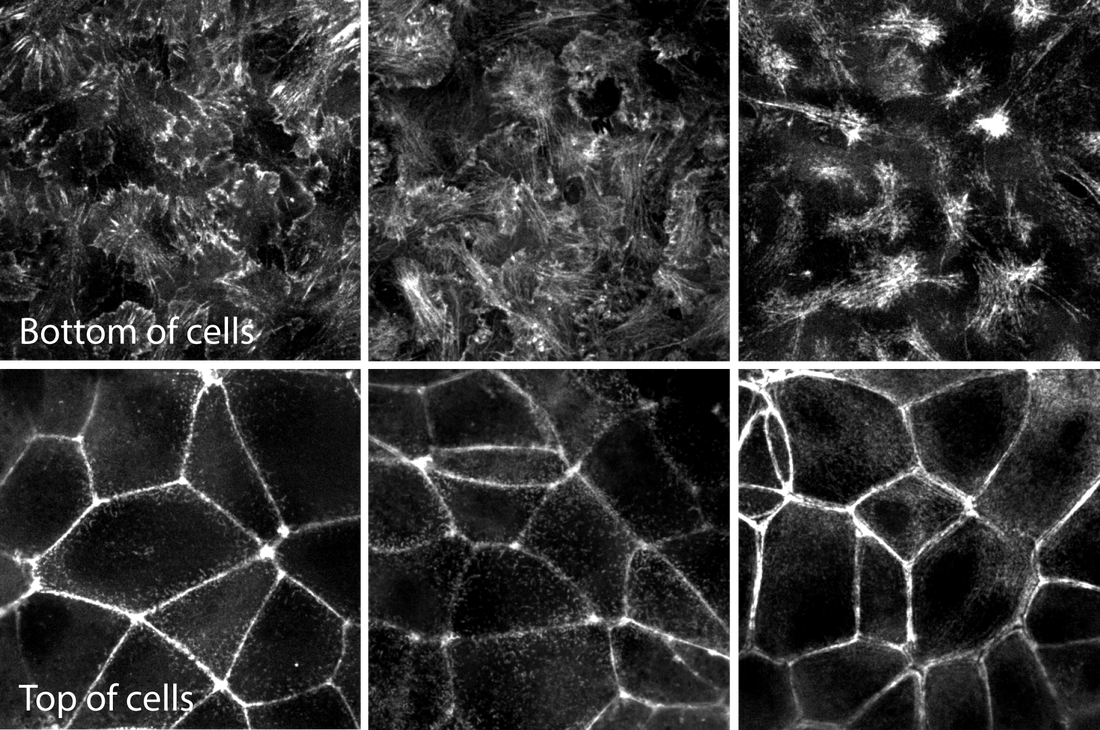
Figure 2. Images of the bottom and top of each structure for easier comparison. Representative images of mEGFP tagged ß-actin (left), α-actinin (center) and non-muscle myosin heavy chain IIB (right) from the bottom (top row) and tops (bottom row) of cells. These images are single slices taken from the z-stacks above. 
Observations
Actin - ß-actin
  • ß-actin comprises cytoskeletal filaments that drive protrusion and provide structural support and generate cellular force.
  • At the bottom of the cells, ß-actin is both in prominent filaments often associated with cell substrate adhesions and at the periphery of cell protrusions (lamellipodia).
  • Near the very top of the cells, ß-actin forms an apical actin band at cell-cell contacts, a feature common in epithelial cells. Small actin puncta of actin are visible along the top surface of cells.
  • ß-actin is also distributed diffusely throughout the cytoplasm and in brighter foci near cell cell contacts in the center of cells.

Actin bundles - α-actinin
  • α-actinin crosslinks actin filaments, forming actin bundles.
  • α-actinin localization is almost identical to ß-actin. The main difference is that α-actinin localizes less strongly to the lamellipodia at the protruding edges at the bottom of the cells, where there are fewer bundles.
  • Like ß-actin, α-actinin is particularly prominent in the actin-containing band near the top of the cell and in the filamentous structures at the bottom of the cell, along the substratum. 

Actomyosin bundles - Myosin IIB
  • Myosin IIB is a contractile motor protein that binds and crosslinks actin filaments.
  • Myosin IIB localization is similar to that of actin and α-actinin, residing in prominent filaments primarily at the bottom and top of cells.
  • At the bottom of cells it is primarily localized to the contractile stress fibers but not in the protruding regions of the cells.
  • Myosin IIB also localizes to the apical actin band found in epithelial cells. However, it is less obviously localized to the actin structures in the center of cells and does not form small puncta at the top surface.

In summary, α-actinin localizes to a subset of actin (e.g. the actin bundles) and myosin IIB to a yet smaller subset (actomyosin bundles) as expected. The general localization pattern of actin containing structures is consistent with an apical-basal epithelial polarity in these cells.

Cell-substrate adhesions via Paxillin

3/17/2017

 
High magnification edge of colony (with overlay)
Low magnification of moving colony
Figure. Movies of paxillin in cell-substrate adhesions. Timelapse movies of hiPS cells expressing EGFP-tagged paxillin imaged on a spinning-disk confocal microscope. Left: images were collected as a partial z-stack near the bottom of the cell every 5 minutes for 160 minutes. Image is a maximum intensity projection and movie is sped up 1500x over real time. Right: single slice images near the bottom of the cell taken every 5 minutes for 400 minutes; playback speed is 3000x real time.

Observations
  • Paxillin is a signaling adaptor that is present in most integrin-mediated sites of adhesions between the cell and the extracellular matrix.
  • In hiPS cell colonies, paxillin primarily localizes to small adhesions which form puncta at the bottom of cells that are less than 0.5 microns in diameter. These adhesions are dynamic, forming and turning over as the edge of the cell protrudes and retracts. Larger, elongated adhesions are also present in these cells particularly along the more protrusive edges of colonies.

Nucleolus via Fibrillarin 

3/16/2017

 
Z-stack
​High magnification timelapse (cell division)
Figure 1. Movies of fibrillarin in Nucleoli. Left: Z-stack of live hiPS cells expressing mEGFP tagged fibrillarin imaged on a spinning-disk confocal microscope. Images start from the bottom of the cells and end at the top. Right: Timelapse movie of live hiPS cells expressing mEGFP tagged fibrillarin. Images were collected in 3D every 3 minutes for 1.5 hours on a spinning-disk confocal microscope. Image is a maximum intensity projection. Playback speed is 900x real time.
Picture
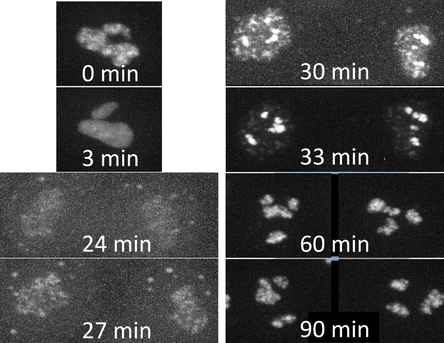
Figure 2. Time series of cell division. A single cell going through cell division taken from the movie on the right.
Observations
  • Fibrillarin marks the dense fibrillar component (DFC) of the nucleolus, the nuclear subcompartment where ribosome biogenesis occurs.
  • During much of interphase the nucleolus exists in 1-2 large, textured clusters within the nucleus of hiPS cells. During cell division, the nucleolus appears to ‘melt’ and then dissociate. After cell division, the nucleolus reassembles, first into small particles and progressing into the larger textured clusters observed during interphase. Low levels of fibrillarin are visible on chromosomes during chromosome segregation in mitosis.

Endoplasmic Reticulum (ER) via Sec61-ß 

3/15/2017

 
Z-stack
​High magnification timelapse (cell division)
Figure 1. Movies of Sec61-ß in ER. Top left: Z-stack of live hiPS cells expressing mEGFP tagged Sec61-ß imaged on a spinning-disk confocal microscope. Images start from the bottom of the cells and end at the top. Top right: Timelapse movie of live hiPS cells expressing mEGFP tagged Sec61-ß. Images were collected in 3D every 2 minutes for 3 hours on a spinning-disk confocal microscope. Image is a single slice through the center of the cells. Playback speed is 600x real time. Bottom image panel: live hiPSC cells expressing mEGFP tagged Sec61-ß imaged on a Zeiss LSM 880 AiryScan FAST in super-resolution mode.
Picture
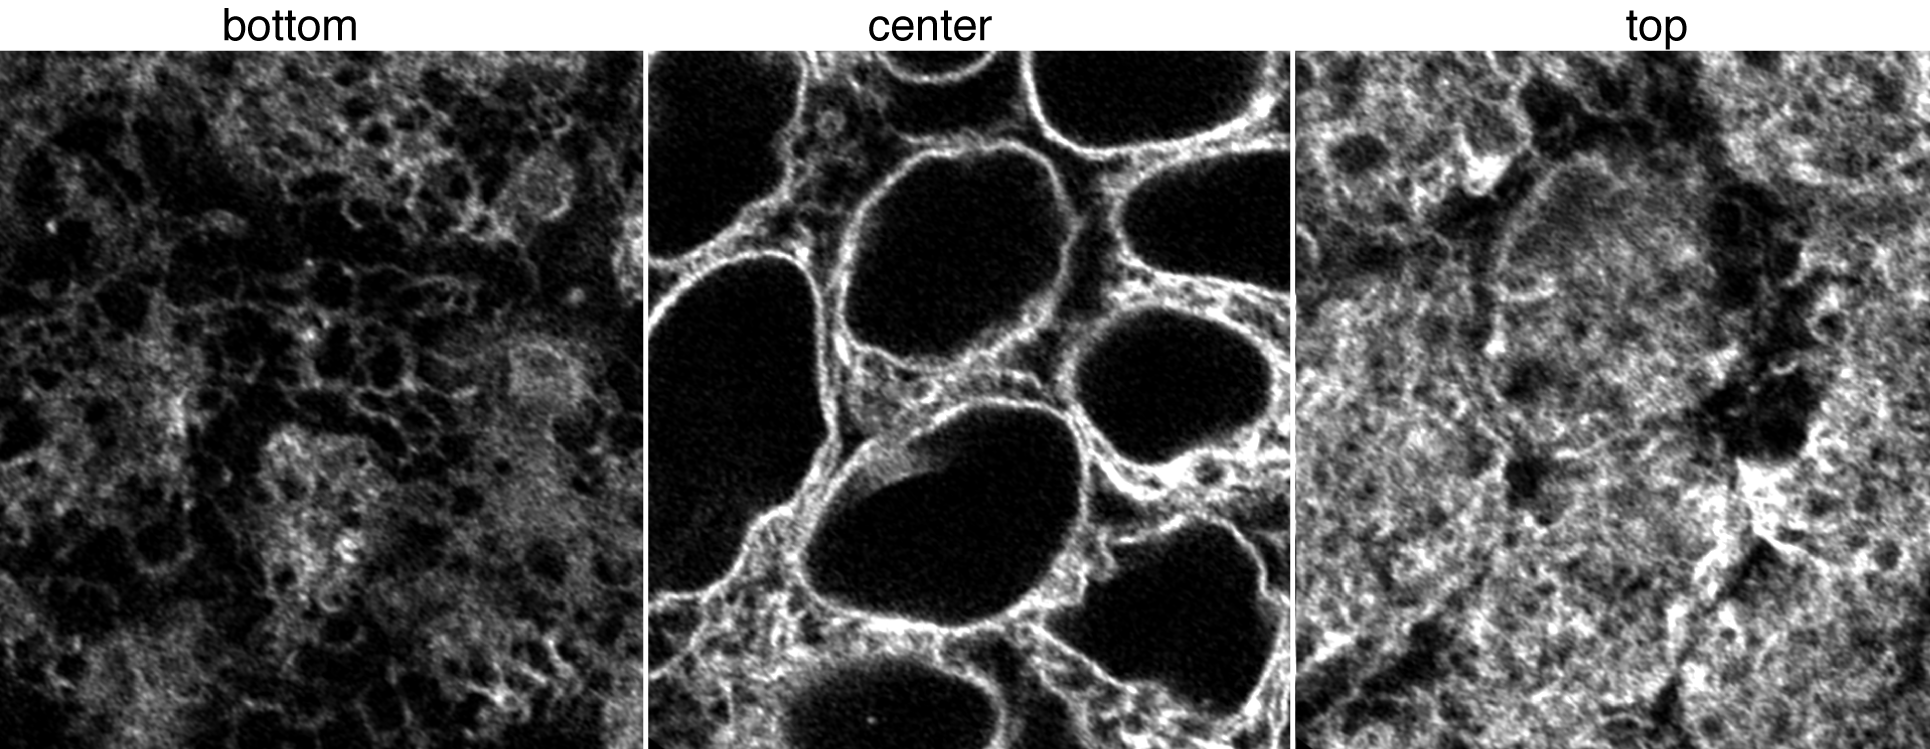
Figure 2. Images of Sec61-ß in ER. Left, middle, and right images represent a single slice at the bottom, center, and top of cells with AiryScanFast SuperRes
Observations
  • Sec61-ß is a member of the Sec61 complex, which is involved in protein translocation and insertion into the ER membrane.
  • In hiPS cells, the ER is localized to the nuclear periphery and in tubules and sheet-like structures throughout the cytoplasm.
  • ER morphology differs at the top vs. the bottom of cells. The ER is more densely packed near the top of cells such that the tubules have a highly branched appearance. The tubules appear longer and less branched at the bottom of cells. This pattern of increased organelle density near the top and decreased near the bottom of cells is similar to that of mitochondria and may also be due to apical-basal variation in microtubule positioning within cells.
  • During cell division, the ER stays mostly intact but the peripheral ER takes on a wavy morphology very similar to that of the nuclear envelope. After division, as the peripheral ER reforms, similar membrane invaginations are seen as in LaminB1 tagged cells. This suggests these invaginations might be composed of both nuclear envelope and ER. These invaginations disappear with time during interphase.

​Mitochondria visualized via Tom20 

3/14/2017

 
Z-stack
​High magnification timelapse (cell division)
Figure. Live cell movies of Tom20 in Mitochondria. Left: Z-stack of live hiPS cells expressing mEGFP-tagged Tom20 imaged on a spinning-disk confocal microscope. Images start from the bottom of the cells and end at the top. Right: Timelapse movie of hiPS cells expressing mEGFP-tagged Tom20 imaged on a Zeiss LSM880 Airyscan FAST in super-resolution mode. Images were collected in 3D every 30 seconds for 30 minutes. Images show a single slice near the bottom of the cell; playback speed is 150x real time.
​
Observations
  • Tom20 is a member of the TOM (translocase of the outer membrane) complex, which permits movement of proteins through the outer mitochondrial membrane and into the intermembrane space of mitochondria.
  • In hiPS cells, mitochondria are localized primarily to the top of cells in the nucleus-free ‘cytoplasmic pocket.’ In the center of cells, they localize perpendicular to the substrate and appear like hollow tubes in cross section, as expected for an outer mitochondrial membrane protein. There are fewer mitochondria at the bottom of cells. This observation is consistent with mitochondrial positioning in the cell being primarily dependent on microtubule positioning during interphase.
  • Mitochondria form long, interconnected tubules as well as smaller separated structures. The longest tubules are most visible at the bottom of cells where mitochondria are less crowded. Mitochondria are dynamic, jiggling due to Brownian motion, moving (presumably along microtubules) and exhibiting fission and fusion dynamics.
  • In mitotic cells mitochondria are more evenly distributed throughout the cell and tend to cluster towards the cell periphery, outside of the mitotic spindle.

Microtubules visualized via α-tubulin in both green (GFP) & red (mTagRFP-T)

3/13/2017

 
Z-stack
High magification (mitosis)
​Low magnification (mitosis)
3D rotation
3D rotation
Figure. Movies of α-tubulin in microtubules. Top left: Z-stack of live hiPS cells expressing mEGFP-tagged α-tubulin imaged on a spinning-disk confocal microscope. Images start from the bottom of the cells and end at the top. Top center and right: Timelapse movies of a hiPSC colony expressing mEGFP-tagged α-tubulin imaged on a spinning disk confocal microscope. Center: images were collected in 3D every 4 minutes for 400 minutes. Images are maximum intensity projections; playback speed is 1200x real time. Top right: images were collected as a single slice near the top of the cell every 1 minute for 65 minutes; playback speed is 900x real time. Bottom row: 3D reconstructions of hiPS cells expressing mEGFP-tagged α-tubulin to visualize both the general organization of microtubules within the cell and the primary cilia at the top of cells.

Observations:
  • α-tubulin polymerizes with ß-tubulin into microtubules, which are a component of the cell’s cytoskeleton. They are important in a number of cellular processes including intracellular transport of organelles and chromosome separation during mitosis.
  • Most of the structures we observe are likely bundles of microtubules instead of individual microtubules. In dividing cells we can observe weak astral microtubules (originating from the spindle poles but not connected to chromosome kinetochores), which could include individual microtubules. Therefore, all brighter tubulin structures are likely bundles of microtubules.
  • In hiPS cells, microtubules localize throughout the cytoplasm. More microtubules are seen near the top of cells with fewer near the bottom; in general microtubules seem to be oriented along the apical-basal axis throughout the center planes of the cell. This suggests microtubule nucleation occurs near the top of cells; however, a clear microtubule organizing center is not consistently seen. In some cells microtubules do seem to radiate from a more central location, which may be cell cycle related.
  • During cell division, cells form bipolar spindles that are most often oriented in the same plane as the cells. However, we do frequently see spindles rotating in all 3 directions during division.
  • After division, sister cells remain connected by their cytoplasmic bridges for 1-2 hours. These bridges often localize to the tops of colonies where they span across multiple cells due the sister cells intercalating to non-adjacent positions within the colony. Tubulin-rich midbodies are present in these cytoplasmic bridges.
  • Bright spots near the top of cells seen in the z-stack represent primary cilia, which are seen in most cells; their absence may be cell cycle related.
  • See FAQs for reasoning behind on our choice of red-fluorescent protein tagging.

    About

    Observations and descriptions from the microscope

    Archives

    February 2019
    August 2018
    April 2018
    October 2017
    April 2017
    March 2017

    Categories

    All
    3-channel
    3D Rotation
    Actin
    Actinomyosin
    Actin Structures
    Adhesions
    Cardiomyocyte
    Cell Cell Contacts
    Cell-cell Contacts
    Cell Contacts
    Cell Division
    Cell Membrane
    Centrin
    Centrioles
    Chromatin
    Colony
    Connexin
    Connexin-43
    Desmoplakin
    Desmosomes
    DNA
    Endoplasmic Reticulum
    Endosome
    ER
    Fibrillarin
    FUS
    Gap Junctions
    Golgi Apparatus
    H2B
    Histone
    K-Ras
    Lamin
    Lamin B1
    LAMP1
    Lysosomes
    MEGFP
    Membrane
    Microtubule
    Mitochondria
    Mitosis
    MLC-2a
    MLC 2v
    MTagRFP-T
    Muscle
    Myosin
    Nuclear
    Nuclear Envelope
    Nuclear Pores
    Nucleolus
    Nucleophosmin
    Nucleoporin
    Nucleus
    Nup153
    Paraspeckles
    Paxillin
    Peroxisome
    Plasma Membrane
    PMP34
    Rab-5A
    Ras
    RNA-binding Protein
    Sarcomere
    Sarcomere M-line
    Sarcomere Thick Filaments
    Sarcoplasmic Reticulum
    Sec61
    SERCA2
    Sialyltransferase 1
    SMC 1A
    ß-actin
    ST6GAL1
    Stress Granules
    Tight Junctions
    Time Lapse
    Time Series
    Titin
    Tom20
    Troponin
    Tubulin
    ZO1
    Z Stack

    RSS Feed

Home

Terms of Use

Citation Policy

Privacy Policy

FAQs

Help

Send us a message

Our diversity, equity & inclusion commitment
Copyright © 2023 Allen Institute. All Rights Reserved.
cellscience.alleninstitute.org
  • About
      Institute
      1. News feed
      2. What we do
      3. Publications
      4. Allen Institute | allenInstitute.org
      5. Careers
      Site
      1. Home page
      2. Site updates
      3. Archived content
  • Allen Cell Collection
      Order cells & plasmids
      1. Cell Catalog
      2. Cell Catalog quickview
      3. Cell Shorts (documentaries on labs using our cells)
      4. Support forum
      Lab methods
      1. Instructional videos for success in the lab
      2. Standard operating procedures (written methods)
      3. Illustrated overviews
      About our hiPS cells
      1. hiPS Cell Structure Overview
      2. Visual Guide to Human Cells
      3. Cell structure observations
      4. Why endogenous tagging?
      5. Differentiation into cardiomyocytes
      6. Genomics
      7. Download cell data (images, genomics, features)
  • Data & Digital Tools
      Online image analysis
      1. Cell Feature Explorer (plotting & 3D viewer)
      2. 3D cell viewer (pre2018)
      3. Deep cell zoom (216,016 cells)
      Online modeling viewers
      1. Visual Guide to Human Cells
      2. Simularium (4D visual analysis)
      3. Integrated Mitotic Stem Cell
      4. └ Z-stack viewer
      5. └ 3D viewer
      6. Allen Integrated Cell viewer
      7. Label-free examples viewer
      8. 3D probabilistic model viewer
      Desktop tools
      1. Allen Cell & Structure Segmenter
      2. AGAVE 3D pathtrace image viewer
      Data & code
      1. Download cell data (images, genomics, features)
      2. Code repositories & software
  • Analysis & Modeling
      Allen Integrated Cell models
      1. Overview
      2. Integrated Mitotic Stem Cell
      3. └ Z-stack viewer
      4. └ 3D viewer
      5. Label-free Determination
      6. └ 3D viewer
      7. 3D Probabilistic Modeling
      8. └ 3D viewer
      9. Visual Guide to Human Cells
      4D biology models
      1. Simularium (online 4D viewer)
      Methodologies
      1. Drug perturbation pilot study
      2. hiPS cells during mitosis
      3. Differentiation into cardiomyocytes
  • Publications
      Articles
      1. All journal publications
      2. Preprints (biorxiv, arxiv)
      Posters
      1. Select posters
  • Education
      Education resources
      1. All Resources
      2. Teaching materials
      Online tools popular with teachers
      1. Visual Guide to Human Cells
      2. Integrated Mitotic Stem Cell
      3. Cell Feature Explorer (interactive plotting & 3D viewer)
      4. 3D cell viewer (pre2018 data)
      5. hiPS cell structure overview
  • Support
      Questions
      1. FAQs
      2. Forum
      Tutorials for digital tools
      1. Digital tool tutorials with videos
      2. Visual Guide tutorial
      3. AGAVE user guide
      Lab methods
      1. Instructional videos for success in the lab
      2. Standard operating procedures (written methods)
      3. Illustrated overviews
  • 🔍
      SEARCHBAR